- Resistance at $8.32 poses a challenge for APT’s upward price movement
- Various market metrics pointed to a contrasting scenario where buyer confidence remains strong
With the wider crypto market facing a downturn as many altcoins declined, Aptos has shown remarkable resilience on the charts. It has surged by 46.58% over the last month, with an additional hike of 5.14% recently.
However, according to AMBCrypto, this rally may only be the beginning, with indicators pointing to a strengthening bullish trend and greater buyer activity.
Resistance turns to support, fueling APT rally despite hurdle
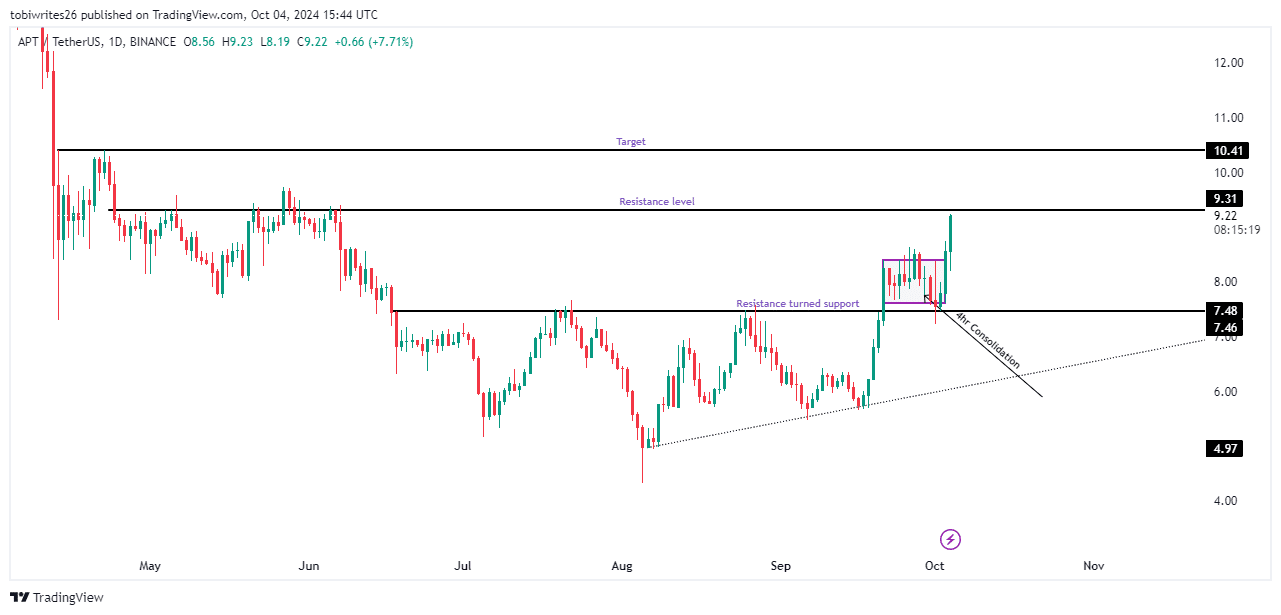
After breaking out of its ascending triangle, APT briefly entered a consolidation phase on the 4-hour chart, dropping to and finding support at $7.46—A level that previously acted as resistance. This transition has significantly contributed to its recent northbound movement.
However, APT now confronts a new challenge – A resistance line just above its press time price that must be breached to ensure further gains.
Should the price sustainably trade above this line and continue to rise, the next important liquidity cluster would be at $10.41. At this level, a price revaluation will be likely, meaning the next move for APT will be determined.

Source: Trading View
Technical indicators lean bullish for APT
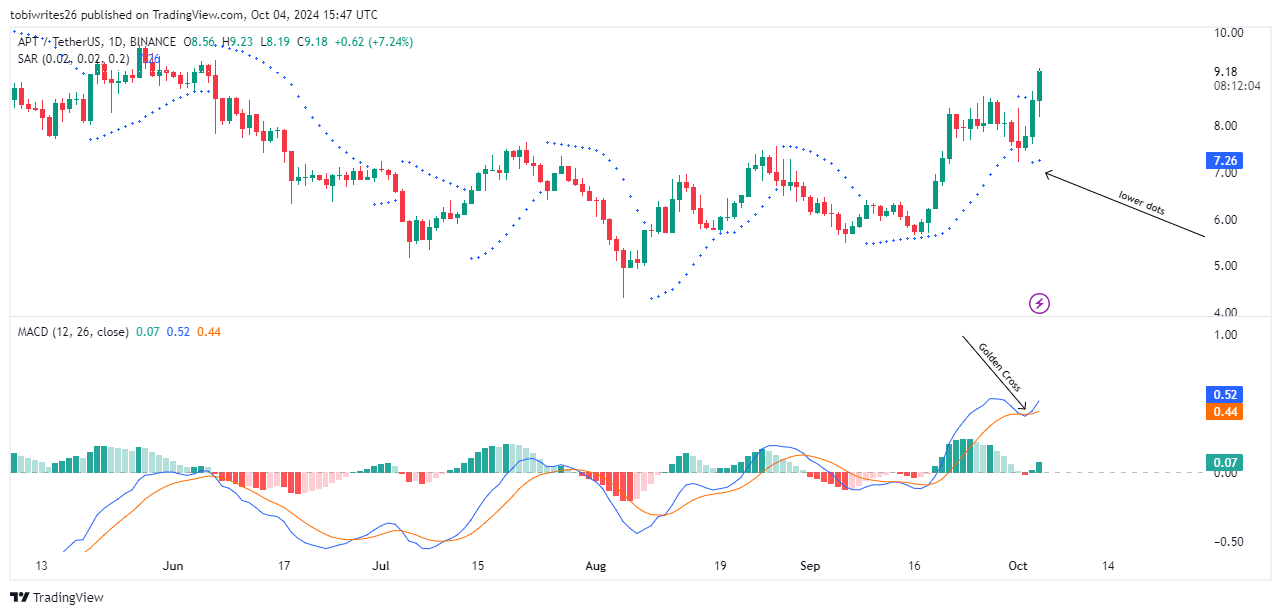
At the time of writing, multiple technical indicators, including the Parabolic SAR and Moving Average Convergence Divergence (MACD), suggested that the recent market activity is fully backed by traders now entering the market.
The Parabolic SAR, which helps identify potential price reversals, was displaying dots below the price, indicating growing buying momentum. An increase in these dots would further confirm the market’s intent to buy.
Meanwhile, the MACD rose in the positive zone and formed a bullish ‘golden cross’—A scenario where the MACD line (blue) crosses above the signal line (orange). This pattern typically means growing participation from market players pushing the price upwards.


Source: Trading View
Together, these indicators hinted that a bullish trend may be imminent. AMBCrypto found out that isn’t all.
On-chain metrics echo bullish sentiments for APT
AMBCrypto also observed that APT’s on-chain metrics have been mirroring its technical indicators, both signaling bullish market readiness.
According to Coinglass, for instance, trading volume and Open Interest have surged by 18.84% and 6.35%, reaching $1.32 billion and $185.01 million respectively. These metrics, which reflect market activity, show major increases correlating with price rises— Pointing to a sustained upward trend for APT.
Simply put, market sentiment indicated that APT is not only expected to surpass its current resistance line, but may also be projected to rally towards $10.41.

