- Shiba Inu’s key technical indicator has suggested the possibility of a future decline.
- The coin’s price remains at risk of significant price swings.
Shiba Inu’s [SHIB] Parabolic SAR (Stop and Reverse) indicator, assessed on a weekly chart, hinted at the possibility of an extended long-term decline.
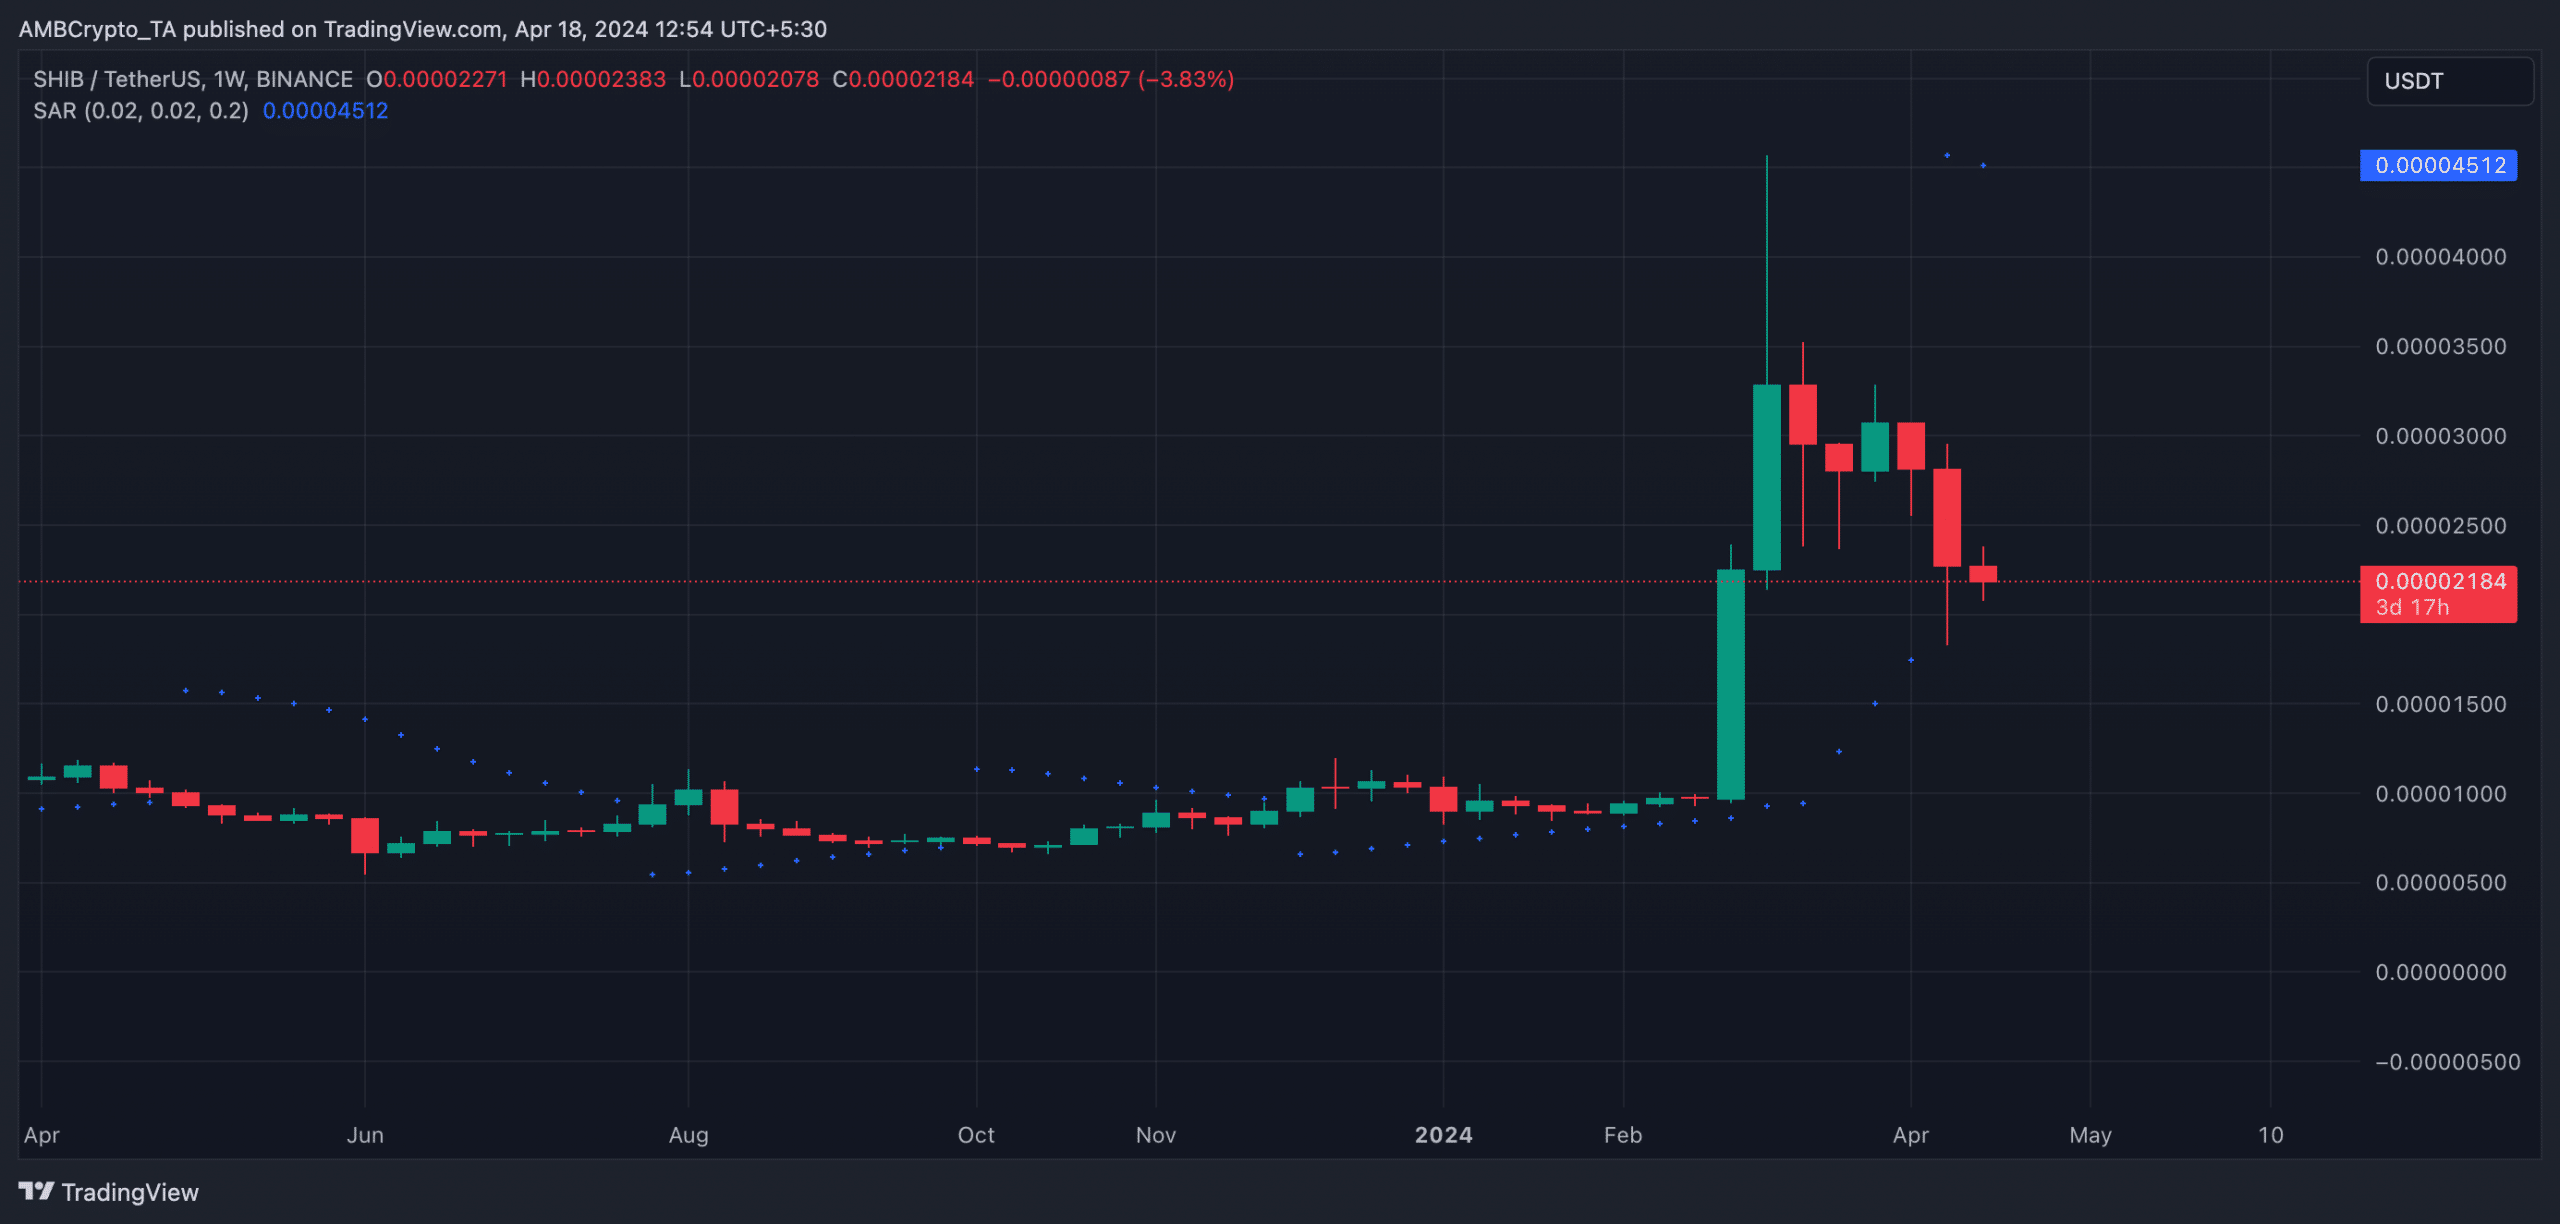
Source: SHIB/USDT on TradingView
The Parabolic SAR indicator is used to identify potential trend direction and reversals. When its dotted lines are placed above an asset’s price, the market is said to be in a decline.
It indicates that the asset’s price has been falling and may continue to do so.
Do not write off the meme coin
Although SHIB’s Parabolic SAR has flashed a sell signal, other key indicators observed within the same time frame showed that market participants have continued to demand the meme coin.
For example, its key momentum indicators rested above their respective center lines at press time. SHIB’s Relative Strength Index (RSI) was 58.08, while its Money Flow Index (MFI) was 65.46.
The values of these indicators showed that SHIB traders favored accumulation over coin sell-offs despite the long-term bearish outlook.
Confirming the uptick in SHIB’s buying pressure, its Accumulation/Distribution Line (A/D Line) was spotted in an uptrend.
This indicator gauges the cumulative flow of money into and out of an asset over a specified period of time. When it rises in this manner, it suggests that liquidity is flowing into the asset, indicating accumulation.
In addition, the value of SHIB’s Elder-Ray Index was positive at press time. This indicator measures the relationship between the strength of buyers and sellers in the market.
When it returns a positive value, it means that bull power is dominant in the market.
SHIB’s MACD line positioned above its signal line confirmed the strength of the bulls. When an asset’s MACD line rests above its signal line, its small moving average is above its longer-term moving average.
This suggests a shift in momentum from bearish to bullish and confirms the possibility of a rally (in the long term in SHIB’s case).
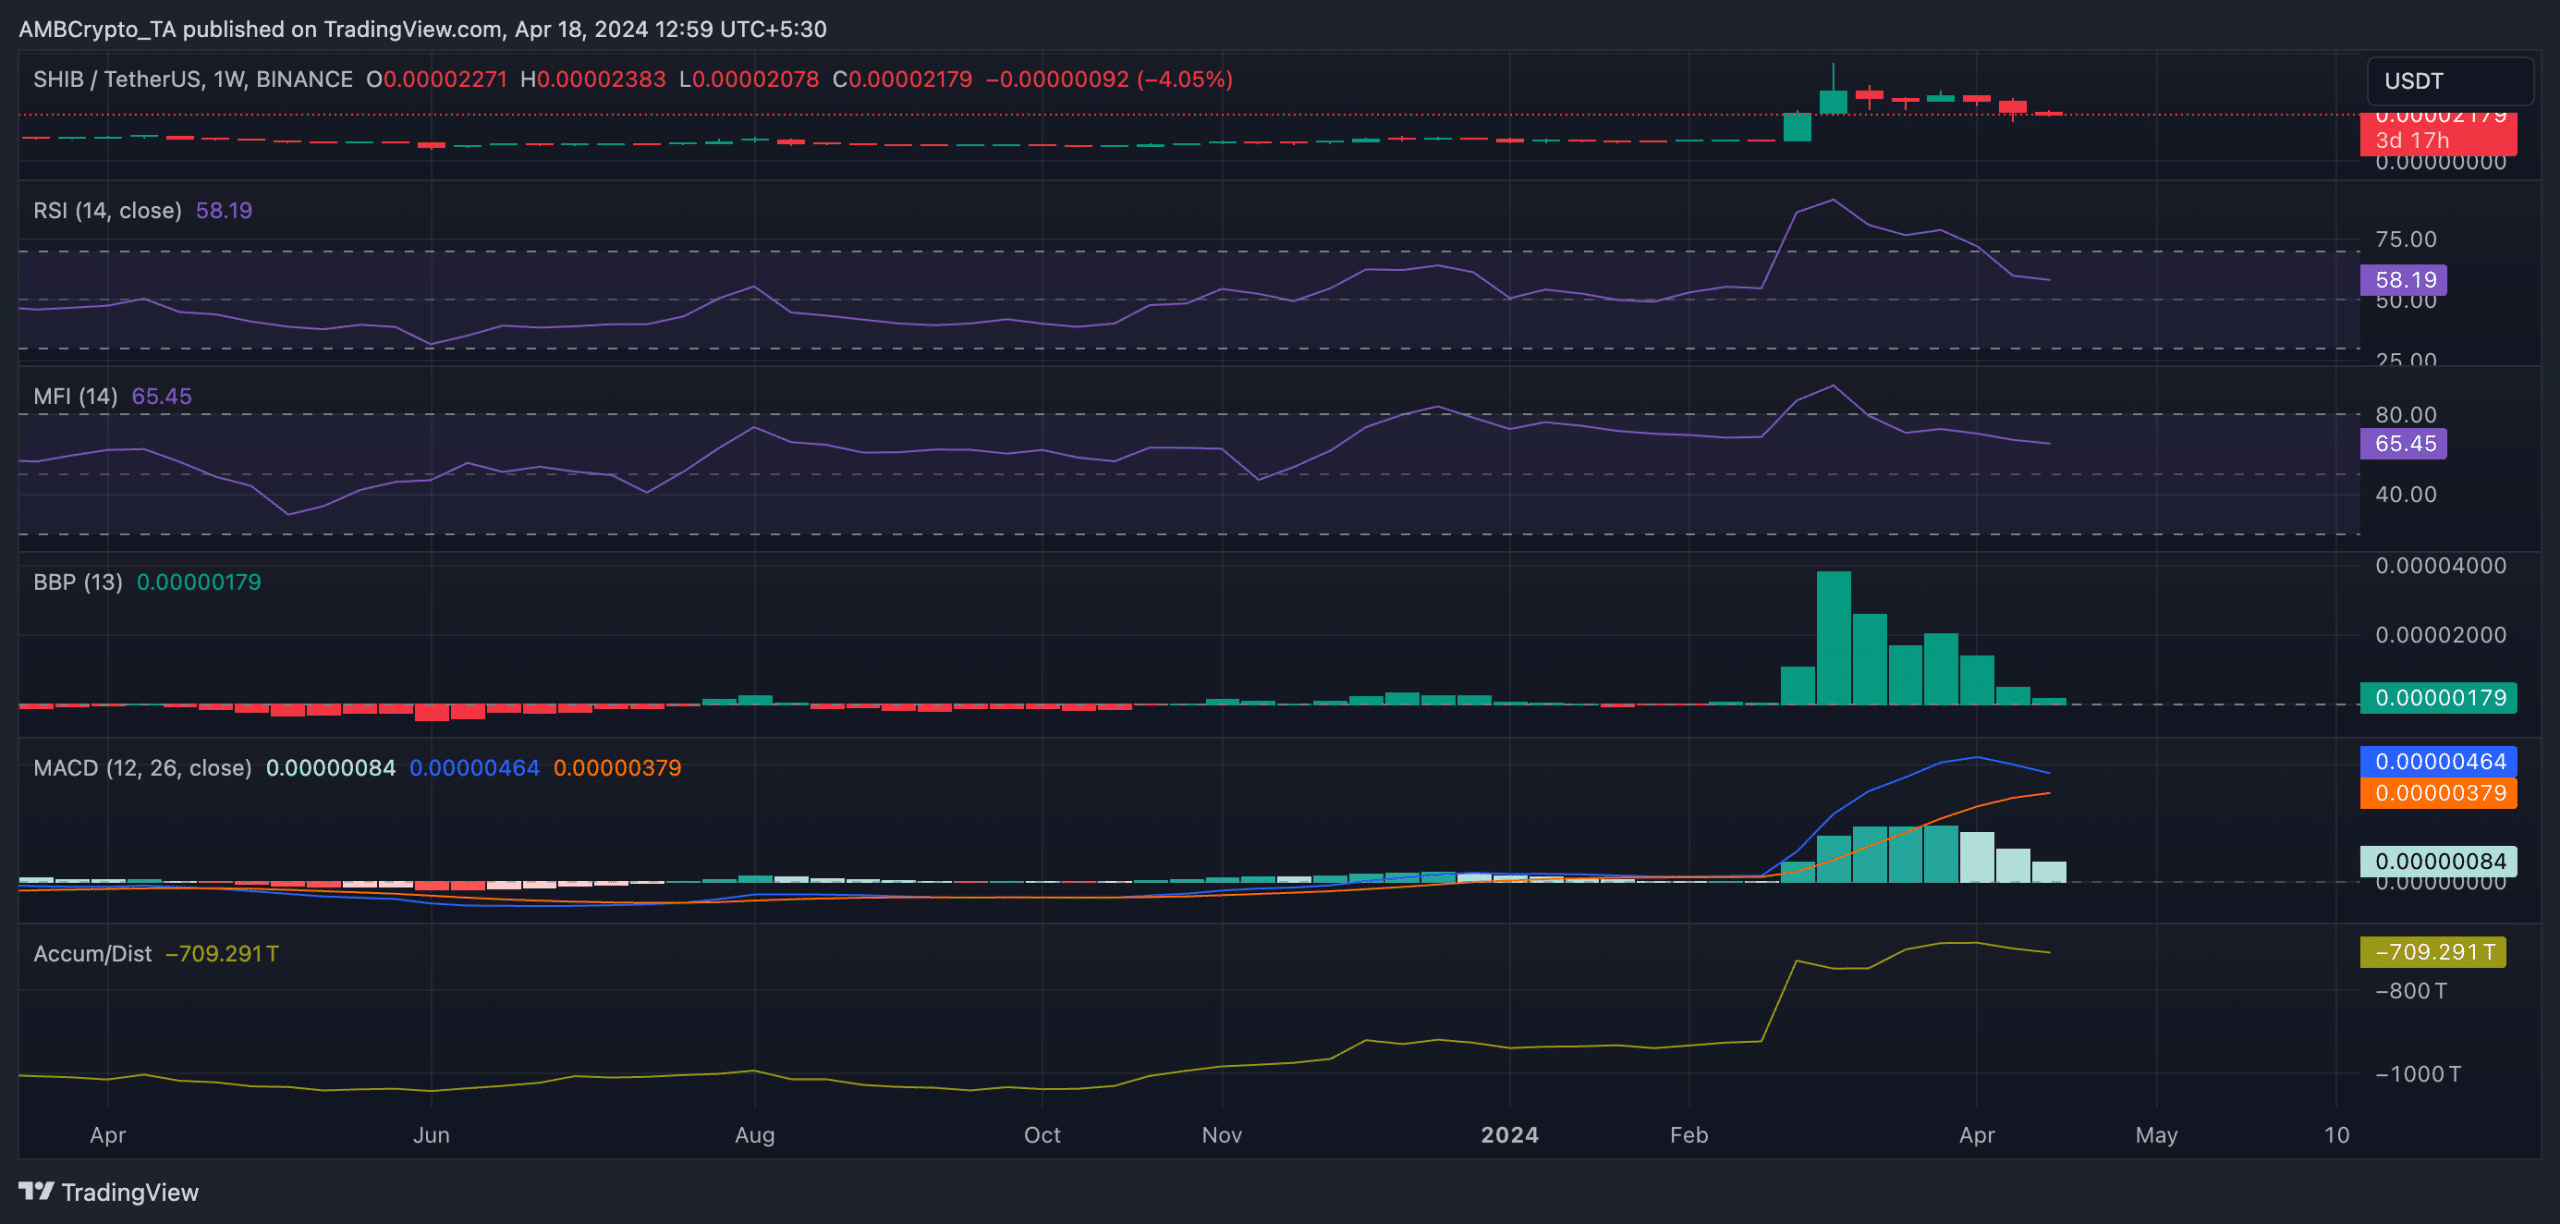
Source: SHIB/USDT on TradingView
Beware of swings
While SHIB’s price may hike long-term, its market has remained significantly volatile.
Read Shiba Inu’s [SHIB] Price Prediction 2024-25
At press time, its Average True Range (ATR)—which measures market volatility by calculating the average range between high and low prices over a specified number of periods—was in an uptrend.
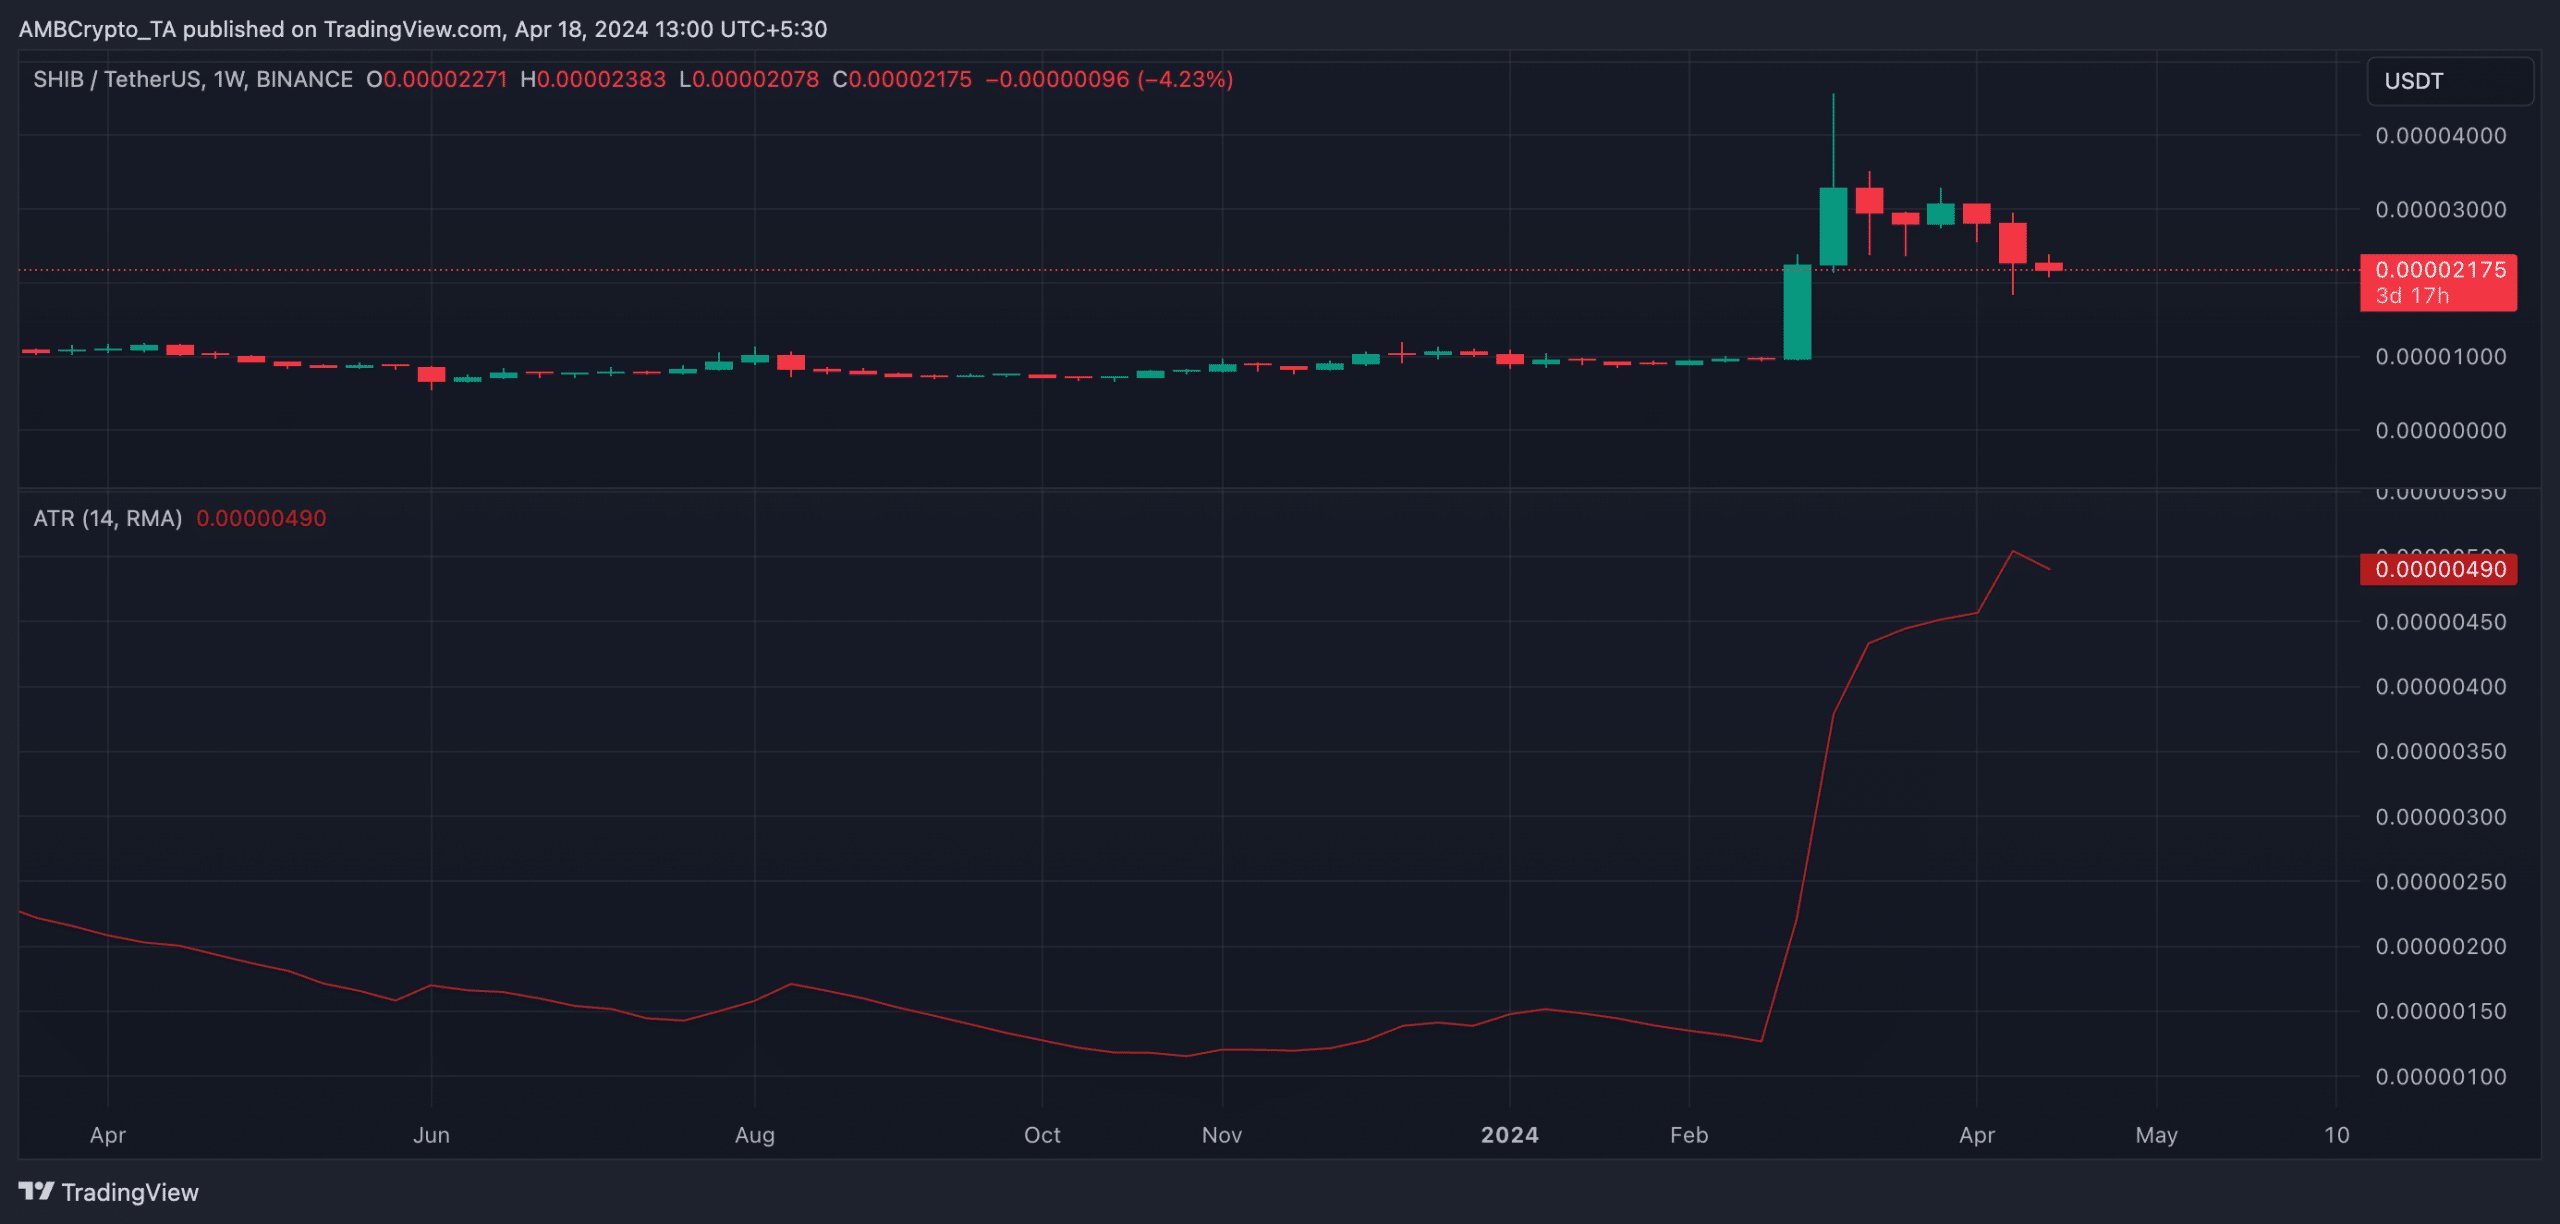
Source: SHIB/USDT on TradingView
When an asset’s ATR surges this way, it suggests that the likelihood of price swings is becoming more significant.