- BNB Chain has seen a decline in network activity lately
- BNB’s derivatives market noted a drop in trading activity over the past 24 hours too
User activity on BNB Chain [BNB] has fallen to a 30-day low, according to data from Artemis. The on-chain data provider revealed that on 17 April, the daily count of addresses that completed at least one transaction on the Layer 1 (L1) blockchain totalled just 1.1 million – A 21% fall from the 1-month high of 1.4 million recorded on 19 March.
Due to the decline in active addresses on the BNB Chain, daily transactions decreased correspondingly. As of 17 April, it registered 3.8 million unique interactions, which, as per Artemis, represented a 21% drop from the 5 million transactions it saw on 19 March.
Whenever a blockchain network registers a fall in user activity, its average transaction fee also plummets. On-chain data revealed that this has been the case with BNB Chain over the past month.
On 17 April, the total transaction fees the chain’s users paid amounted to $659,000. This was a 56% decline from its year-to-date high (YTD) of $1.6 million recorded in total transaction fees on 15 March.
As a result, the past few weeks have been marked by a steady drop in network revenue.
In fact, according to Artemis, on 6 April, BNB Chain’s revenue totalled $57,000 – Its lowest since February. As of 17 April, its daily revenue was just $66,000, having declined by 22% since the beginning of the month.
A positive trend for BNB on the charts
At press time, BNB was valued at $560. Mirroring the slight uptick in the cryptocurrency market over the past 24 hours, the altcoin’s value rose by 3% during that period, according to CoinMarketCap.
Read Binance Coin’s [BNB] Price Prediction 2024-25
BNB’s price performance, assessed on a 12-hour chart, highlighted a steady uptick in demand for the altcoin.
For instance, its Chaikin Money Flow (CMF) indicator, which measures the flow of money into and out of the asset, was on an uptrend and returned a positive value.
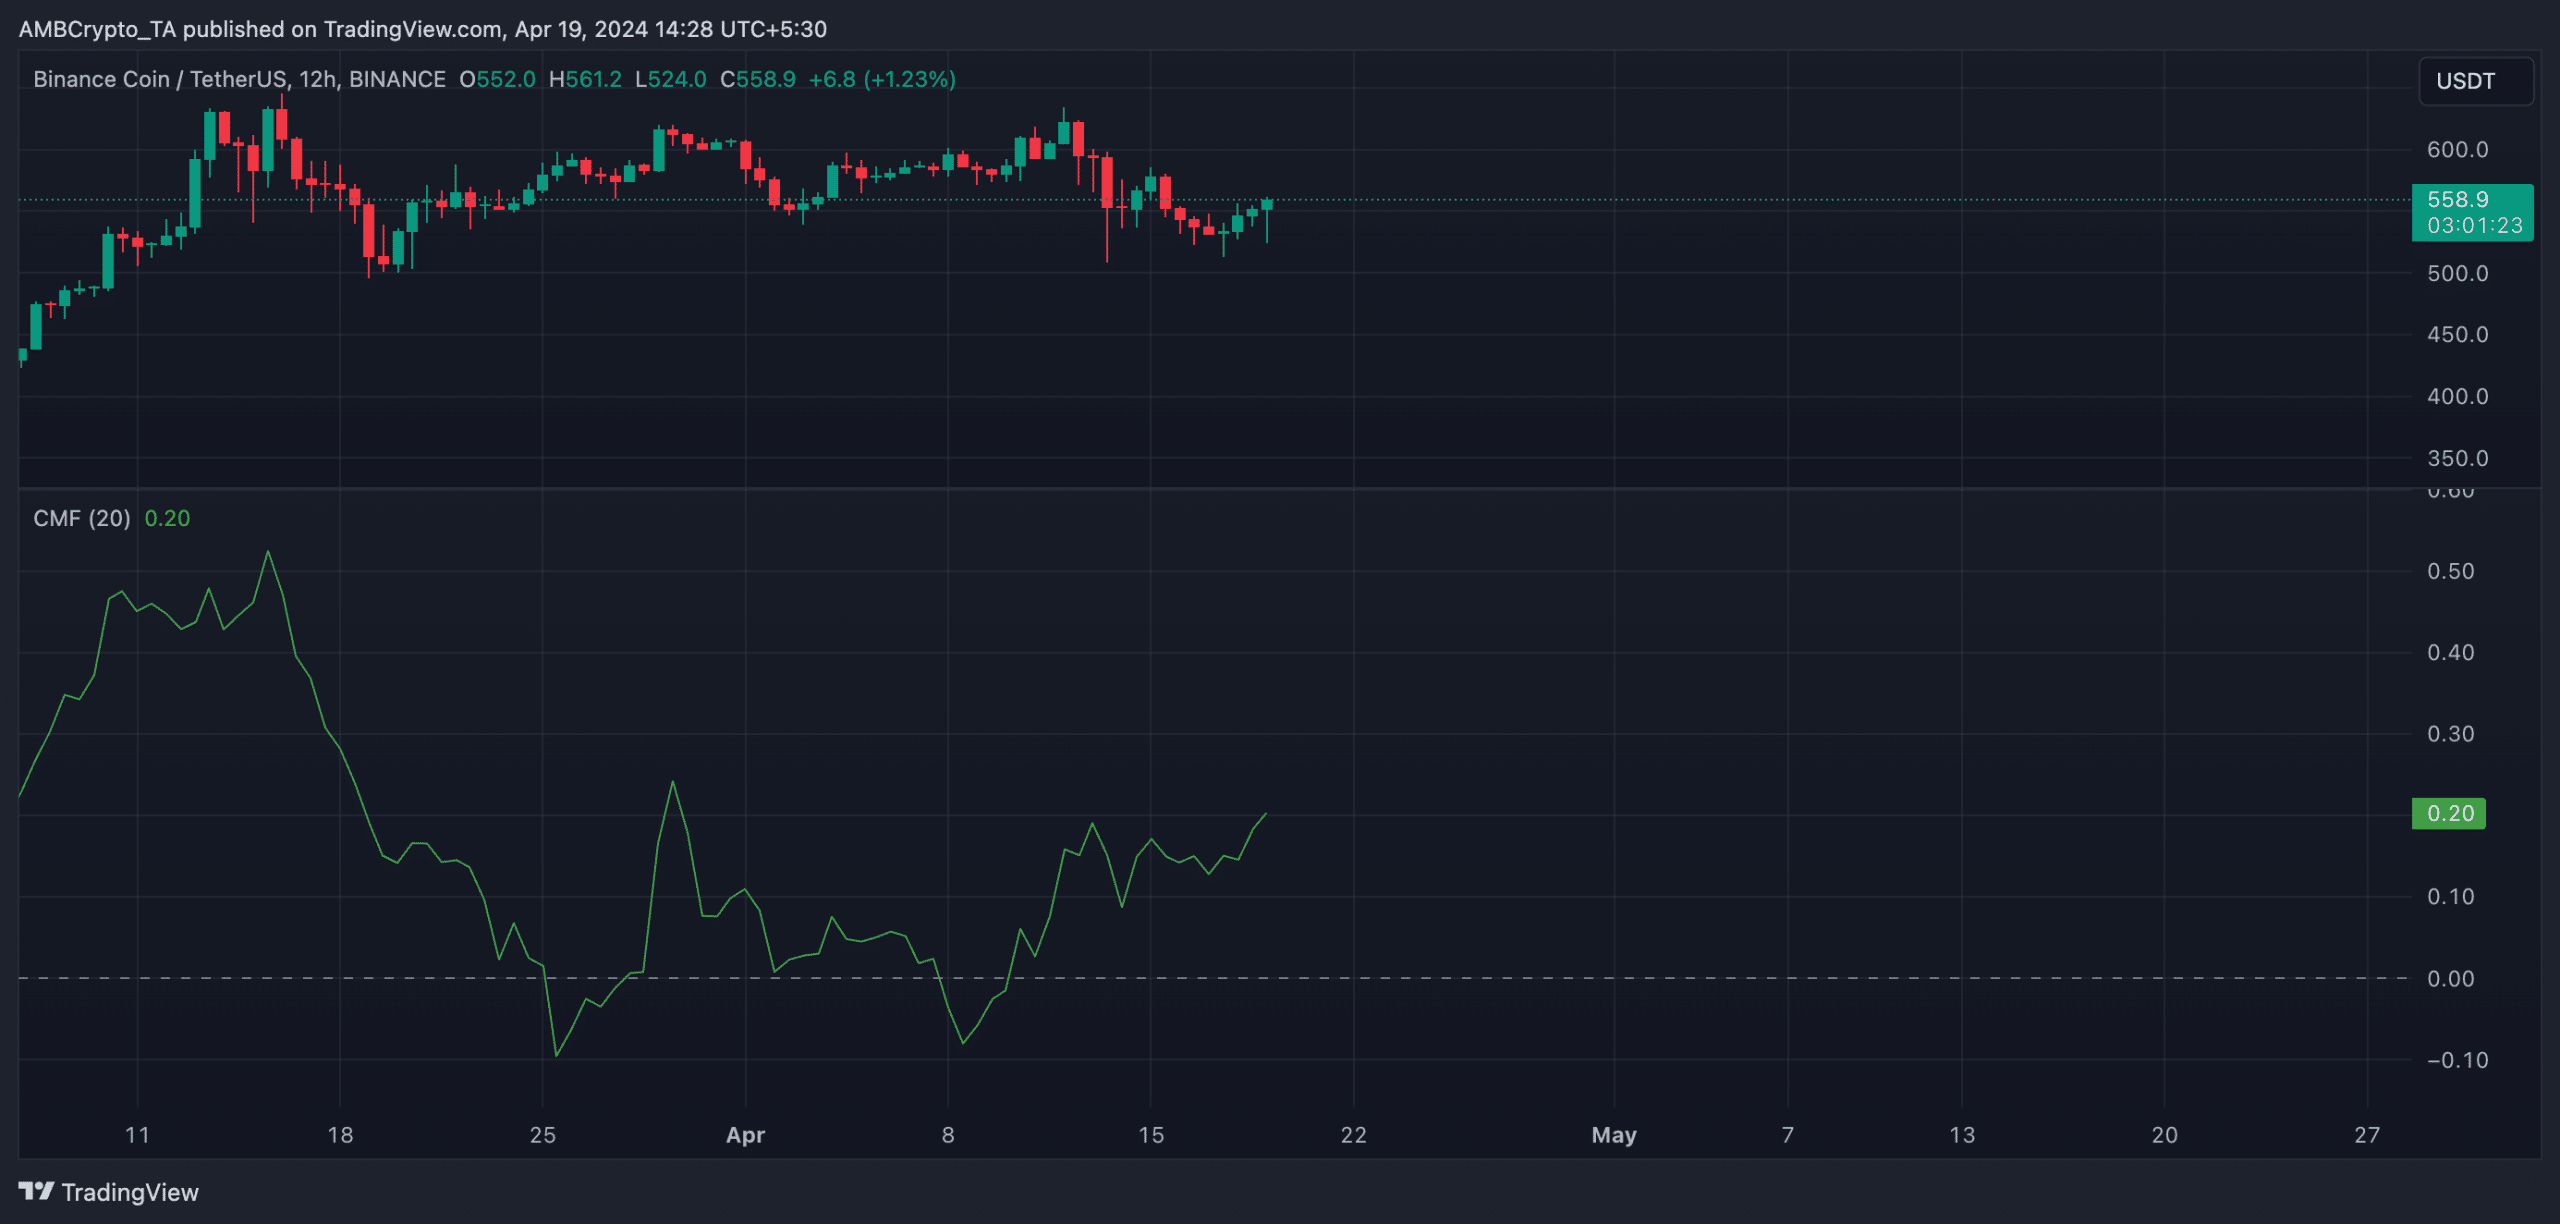
Source: BNB/USDT on TradingView
A CMF value above zero is a sign of market strength, as it suggests an inflow of liquidity required to sustain price growth in the short term.
However, an assessment of the coin’s derivatives market performance revealed a surge in bearish sentiment. In fact, according to Coinglass data, the coin’s open interest has fallen by 7% in the last 24 hours alone. Simply put, it could be a tricky period to navigate for BNB.