While the housing market seems like the least of our financial worries right now as stock markets are melting down around the globe, we track housing here at HousingWire, so it opens the question: how quickly could we see impact in the housing market and in which data would we see it first?
We have two competing forces that will impact home buyer demand. Mortgage rates, of course. If rates fall, that obviously helps demand. But if the economy shrinks, unemployment spikes, and people are worried about their wealth or income, those are negative forces. Rates vs. recession. What if rates fall because the economy tanks? Which force wins?
This is tricky because we haven’t had to worry about the economy for 15 years. In housing, it has been an interest rate game for a very long time. Rates go up, demand weakens and inventory builds. Rates go down, demand increases, inventory falls, prices rise.
In the past three years, we’ve had rising and elevated interest rates, and inventory is way up. But in that time employment has been very strong. The U.S. economy has been growing better than anywhere in the world. So, housing has been primarily an interest rate game.
But if we face a situation where the economy shrinks, that will decrease household formation and housing demand. That means even if mortgage rates move a little lower, we could still see decreased demand for homes (and for rentals too).
What’s frustrating is that home sales had been ticking up in recent weeks. Weekly pending home sales are starting to come in a couple percent above the year-ago levels. Will that metric be the first to turn south? Will we see price reductions tick higher? Or will we see it in the weekly new listings volume?
Or, what if we don’t see impact at all?
I have pointed out lately the American homeowner is in very strong financial shape, and that their strongest financial asset is their ultra-cheap 30-year fixed mortgage. Stock market wealth can evaporate by trillions in a matter of days. We can lose our jobs. But even if home prices outright crash, Americans have the ultra-low mortgage rate locked in forever and have the lowest loan-to-value ratio in essentially forever at only 47%. We are underleveraged on our homes.
So even if home prices crash 20% across the board — bigger than 2008 — American homeowners will still have a ton of equity. And home prices could indeed fall, though there’s no signal of a crash anywhere in the data. But there are now eight states with lower home prices than a year ago.
You can’t take away that great mortgage, and that’s important because we’ve never entered into a recession with homeowners in such strong position. Now, some of those homeowners are overleveraged on their cars and credit cards and will lose their jobs. Some of those folks will be forced to sell their homes. But think about it this way; if I have a 3% mortgage and I lose my job, I can’t sell the house and rent somewhere cheaper. My mortgage is the cheapest I’m ever going to get. So, I’m going to fight like hell to hold on to that house.
The point is that we have suddenly new forces, not just mortgage rates, driving real estate demand and supply, so it’s more important than ever to track the weekly moves in the market.
We’ll take a quick dive into these market dynamics today. In two weeks we’ll have our April webinar where we get to take a full hour to explore all the data, including latest economic impacts and the local markets, which are on two far ends of the spectrum; Northeast vs. Sunbelt.
Let’s take a look at the data and we’ll see the specifics.
Weekly pending home sales
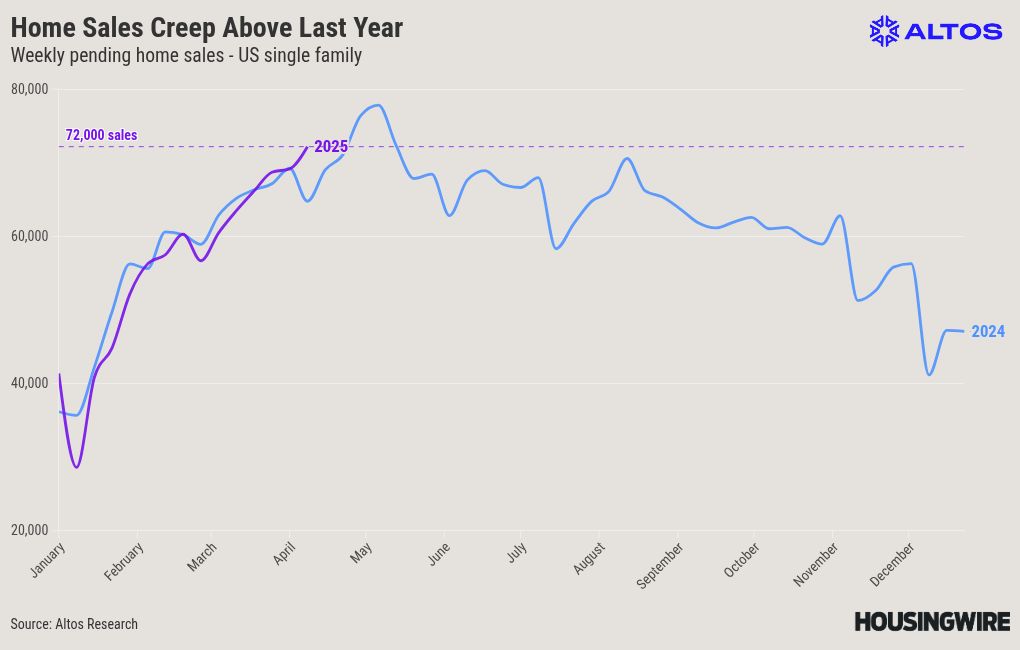
Let’s start today with the weekly pending home sales. Even as economic craziness looms large on the horizon, as of the beginning of April, home sales have been ticking up, finally. People who made offers on homes last week obviously aren’t generally yet impacted by new policy insanity. So, those homebuyers are marching forward.
In fact, my gut says that stock market turmoil doesn’t translate into too much change in home buyer demand in the near-term. In fact, rapidly lower mortgage rates could move some buyers off the fence in the next couple of weeks. So for the next few weeks, expect the recent slight momentum in buyer activity to continue.
There were 72,000 newly pending home sales this week for single-family homes. There were another 15,000 condo sales newly pending. 87,000 total was the most weekly pending sales since the end of April a year ago. Because mortgage rates were rising quickly back then, home sales slowed in May, June, and July. This year’s pattern has been on a trajectory to finally see some sales growth over 2024 with slightly lower rates. I expect the next couple of weeks, unless things get even crazier in the financial markets, to continue that trend.
Last year at this time was the Easter holiday, which was a bit early. So, the comparison to sales last year was a big jump. There were 11% more home sales now than the same week a year ago. In the chart here, you can see this year’s purple line is marching above the blue line from 2024. This year’s line will have the Easter holiday dip later in the month.
There are 368,000 single-family homes in contract. After a few weeks of increasing weekly pending sales, there are now more homes in contract than last year. Just 1% more than last year, but it’s inching higher. Homes in contract now will close mostly in April and May.
The takeaway for home sales is to expect that we’ll see slight gains through April. Unless real catastrophe is unleashed. Then we’ll be able to see here how quickly demand turns.
New listings
The trend for 2025 is that we have more sellers each week, finally growing to the old normal levels. There were 72,000 new listings this week for single-family homes. That’s 5.8% more new listings than last week. It’s 31% more sellers than last year, which included the Easter holiday so it’s not a direct comparison. But still, more sellers.
Back in 2019, there were 85,000 new listings this first week of April, so 72,000 now isn’t a lot, but it’s the most for this week in the six years since then. New listings are growing but aren’t overwhelming.
In this chart, each line is a year with the weekly new listings counts. The gray lines at the top of the chart are the years before the pandemic: 2017, ’18, ’19.
In those times, it was totally normal for 80,000 to 100,000 sellers of single-family homes to list each week. The purple line here shows how 2025 is finally getting closer to normal. The blue line is last year, and every week we have more sellers than a year ago. Seller growth is inching higher across the country, even in places like Connecticut, which still has ultra-low inventory.
Some of the new listing growth is from three years with more expensive mortgages. The more folks with a 6-handle on their mortgage, the less likely they are to hoard real estate, so those get relisted faster. Some of the new listings growth I suspect is from early sensitivity to a changing economy, or sellers who want to get out before it gets worse.
Like I said, we haven’t had this dynamic in a very long time, with the exception of a few weeks at the start of the pandemic. So, watch the new listings rate to see if homeowners buckle down and keep their great mortgages or if economic forces dominate and force people to unload.
So far, I characterize the rise in seller volume as generally healthy. More sellers is good.
Inventory
There are now 691,000 unsold single-family homes on the market. That’s an increase of 2.3% or 16,000 homes this week. That’s a solid increase, though it’s not crazy. Just like the new listings pattern, supply is growing but it is not exploding.
Unsold inventory is now 34.75% greater than last year. The gap compared to last year is expanding. I had been expecting that gap to compress a bit, but that is not happening. It’s looking more and more likely that 2025 is the last of the inventory shortage, at least on a national average.
Keep in mind that most of the inventory gains are across the Sunbelt. And inventory is still very tight in the Northeast.
As we look at the long-term trend of unsold inventory in the U.S., the takeaway is that plenty of supply implies very little home price appreciation pressure. As we move out of the shortage phase, we can see price pressures finally materializing.
Home prices
When we look at prices we can see how there is little or no home price appreciation over 2024. In fact, on a national level, home prices could turn negative this year.
The median price for this week’s newly pending home sales was $397,500. That’s just a quarter of a percent higher than last year at this time. Now, this is a national average. There are 8 states with lower prices than last year at this time; Texas and Florida, Arizona, Georgia, and South Carolina across the Sunbelt. We’re also tracking Iowa, South Dakota, and Washington with slightly lower home prices than last year. I expect Colorado, Louisiana, and maybe Tennessee would be the next states to go negative.
Two takeaways from the home price data; there’s nothing that says “home price crash.” When I say “negative,” I mean like 1% or 2% less expensive than a year ago. These are slight moves. Secondly, if mortgage rates were to react to economic turmoil and drop quickly, then I’d actually expect a bit of a price bounce like we saw in September last year, which you can see in the blue line at the right end of the chart here.
Price reductions
Price reductions are often a very fast indicator of demand shifts. When mortgage rates spike, price cuts spike almost immediately. That’s because when a house is on the market expecting offers that don’t come in, one immediate tactic is to do a price cut to stimulate demand. You can see mortgage rate spikes show up in price reductions in this chart in the green line, which I’ve highlighted from 2022 starting in March and spiking again in September that year. The price cuts happen pretty much immediately.
This year, as of the beginning of April, home buyer demand has been weak, so price reductions are high. 35.1% of the homes on the market have taken price cuts. That’s more than any April in the last decade. Price cuts barely budged higher this week, which implies some reasonable demand. This year’s purple line remains elevated. It shows how little forward pressure on home prices there is already.
As I’ve mentioned, my gut says that stock market turmoil doesn’t translate into too much change in home buyer demand immediately. In fact, rapidly lower mortgage rates could move some buyers off the fence in the next couple of weeks. My gut says the next few weeks, the recent slight momentum in buyer activity continues. But if fear does begin to pervade the housing market, we’ll see it in this data very quickly.
If you need to communicate about the housing market with potential buyers and sellers, join us at Altos.