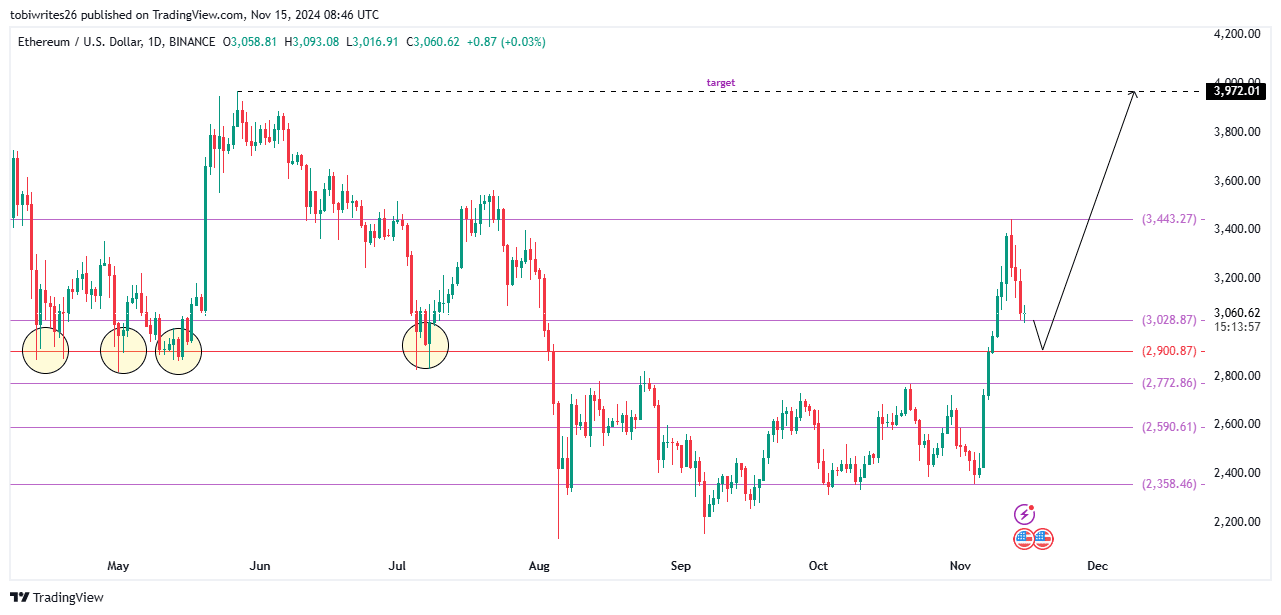
- Trading at a support level defined by the Fibonacci retracement line at press time, ETH is likely to breach this level soon.
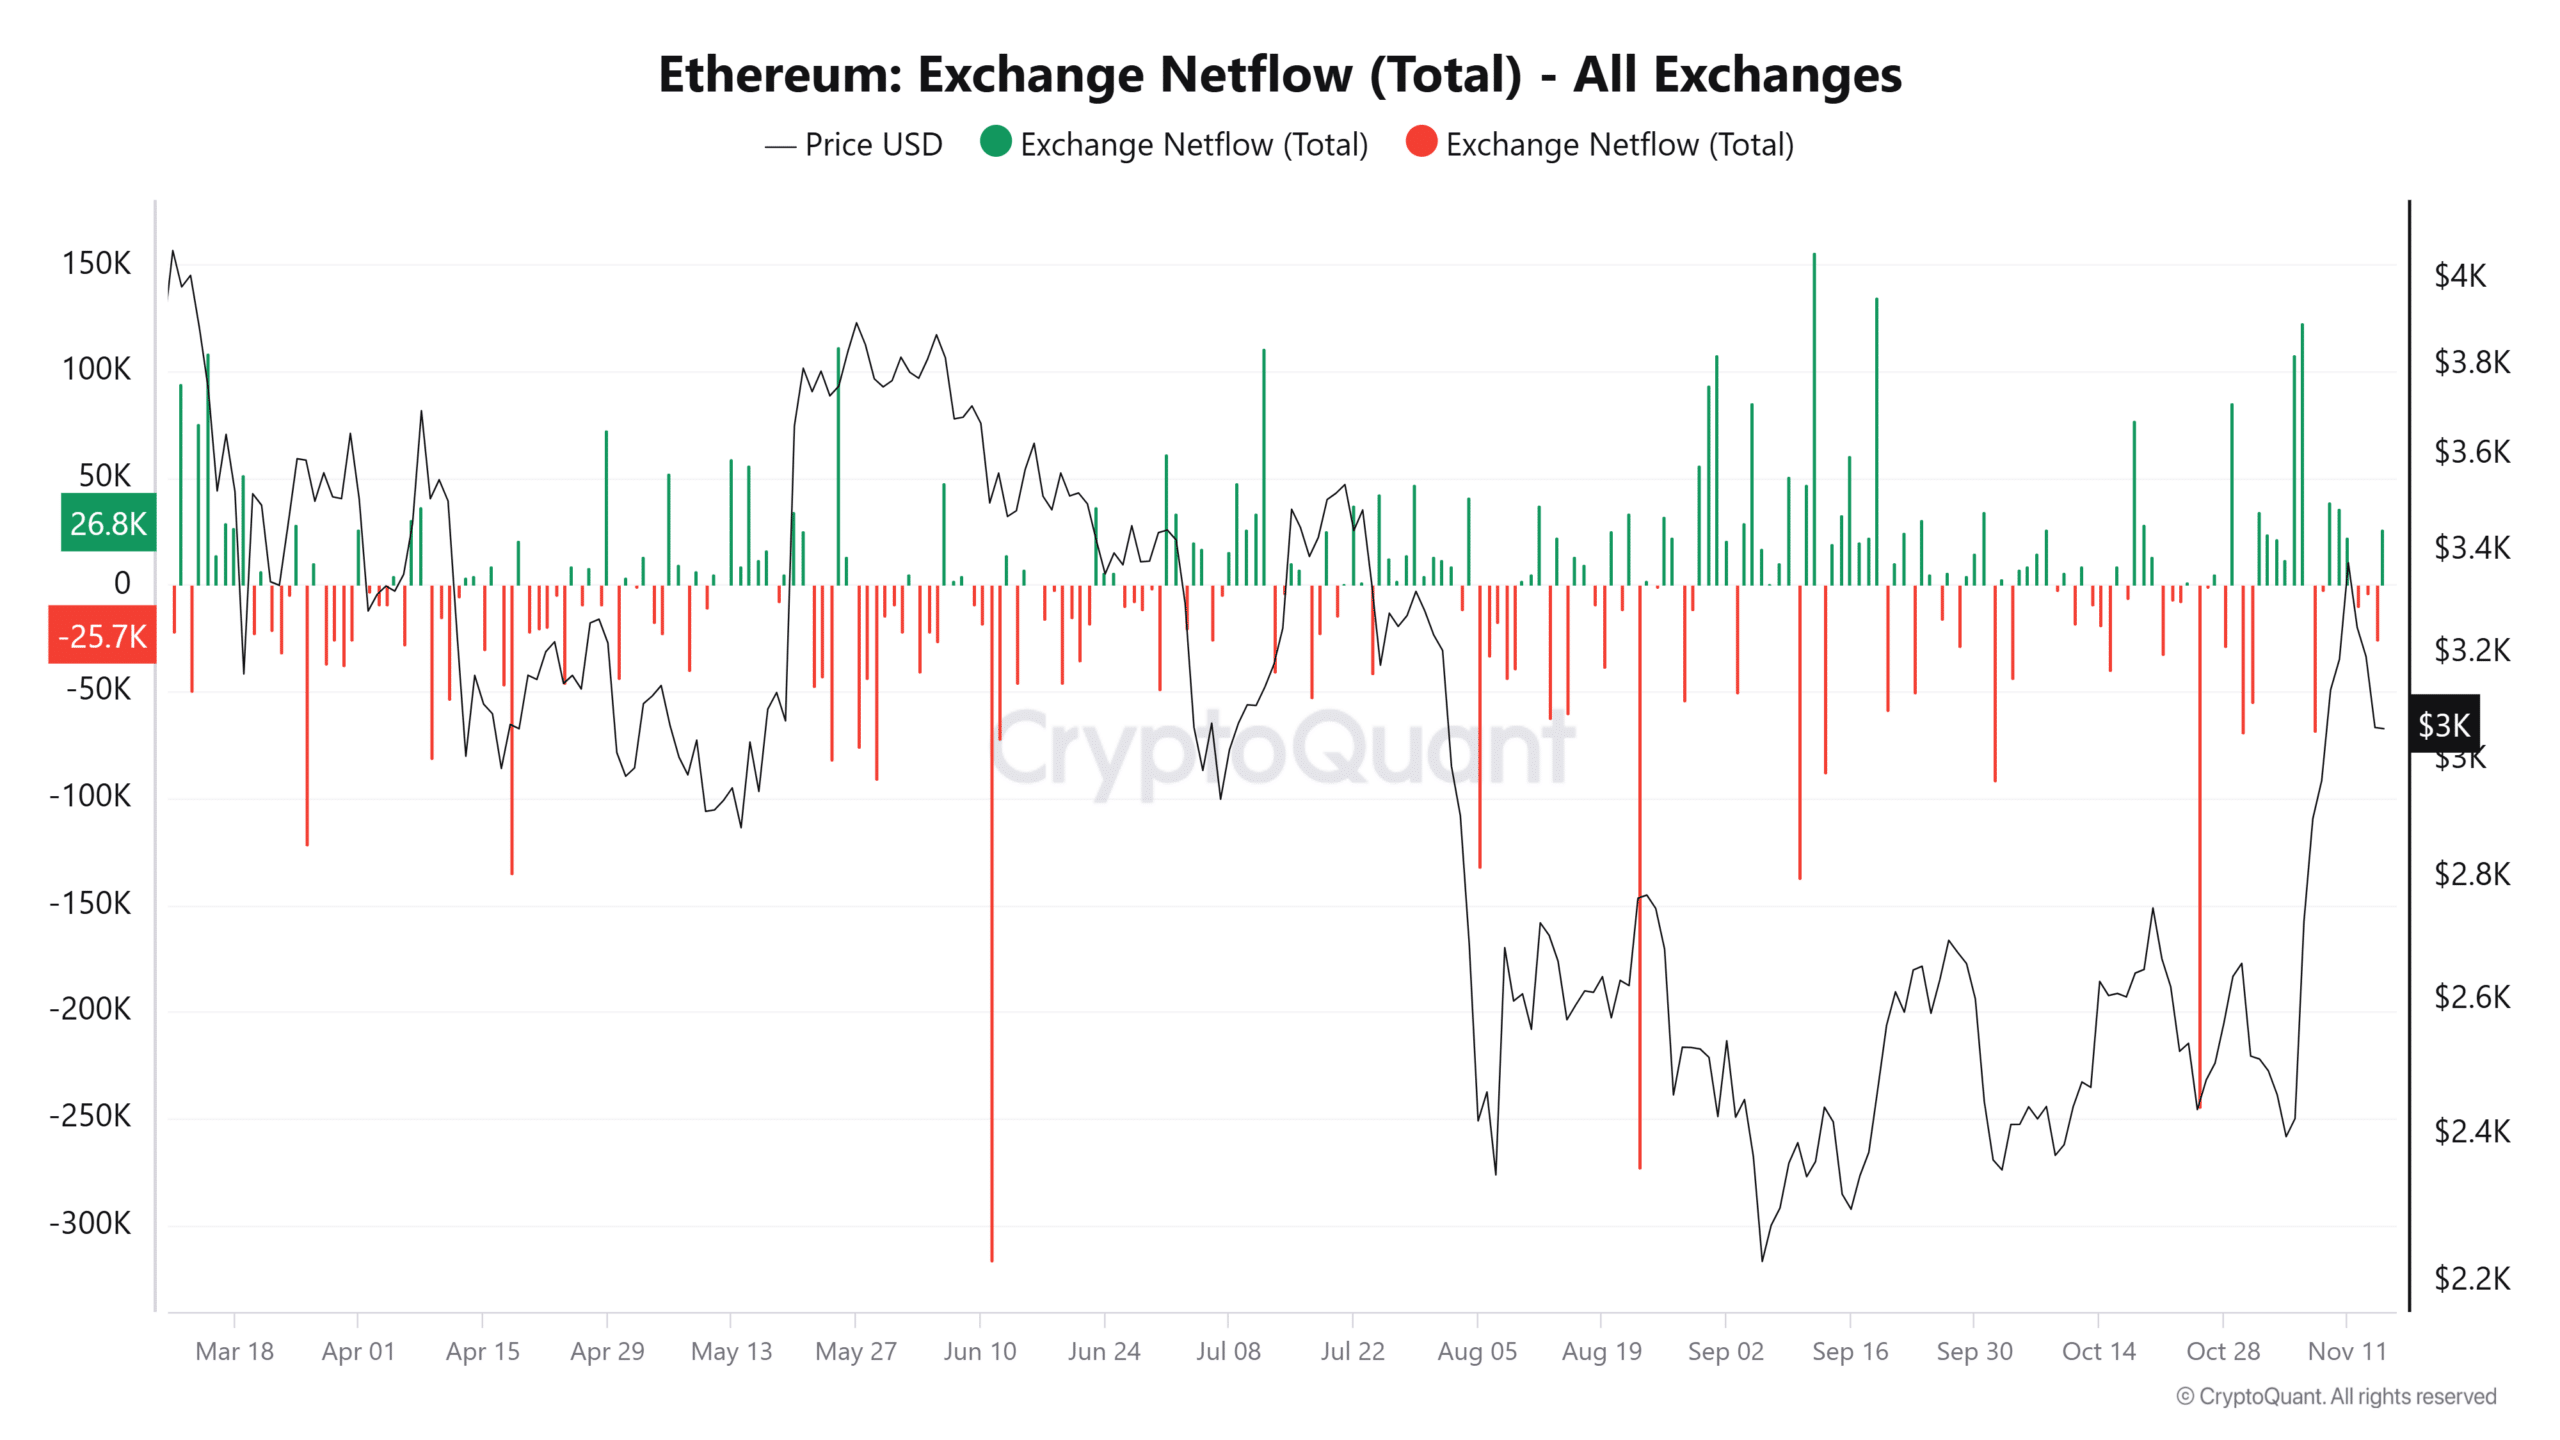
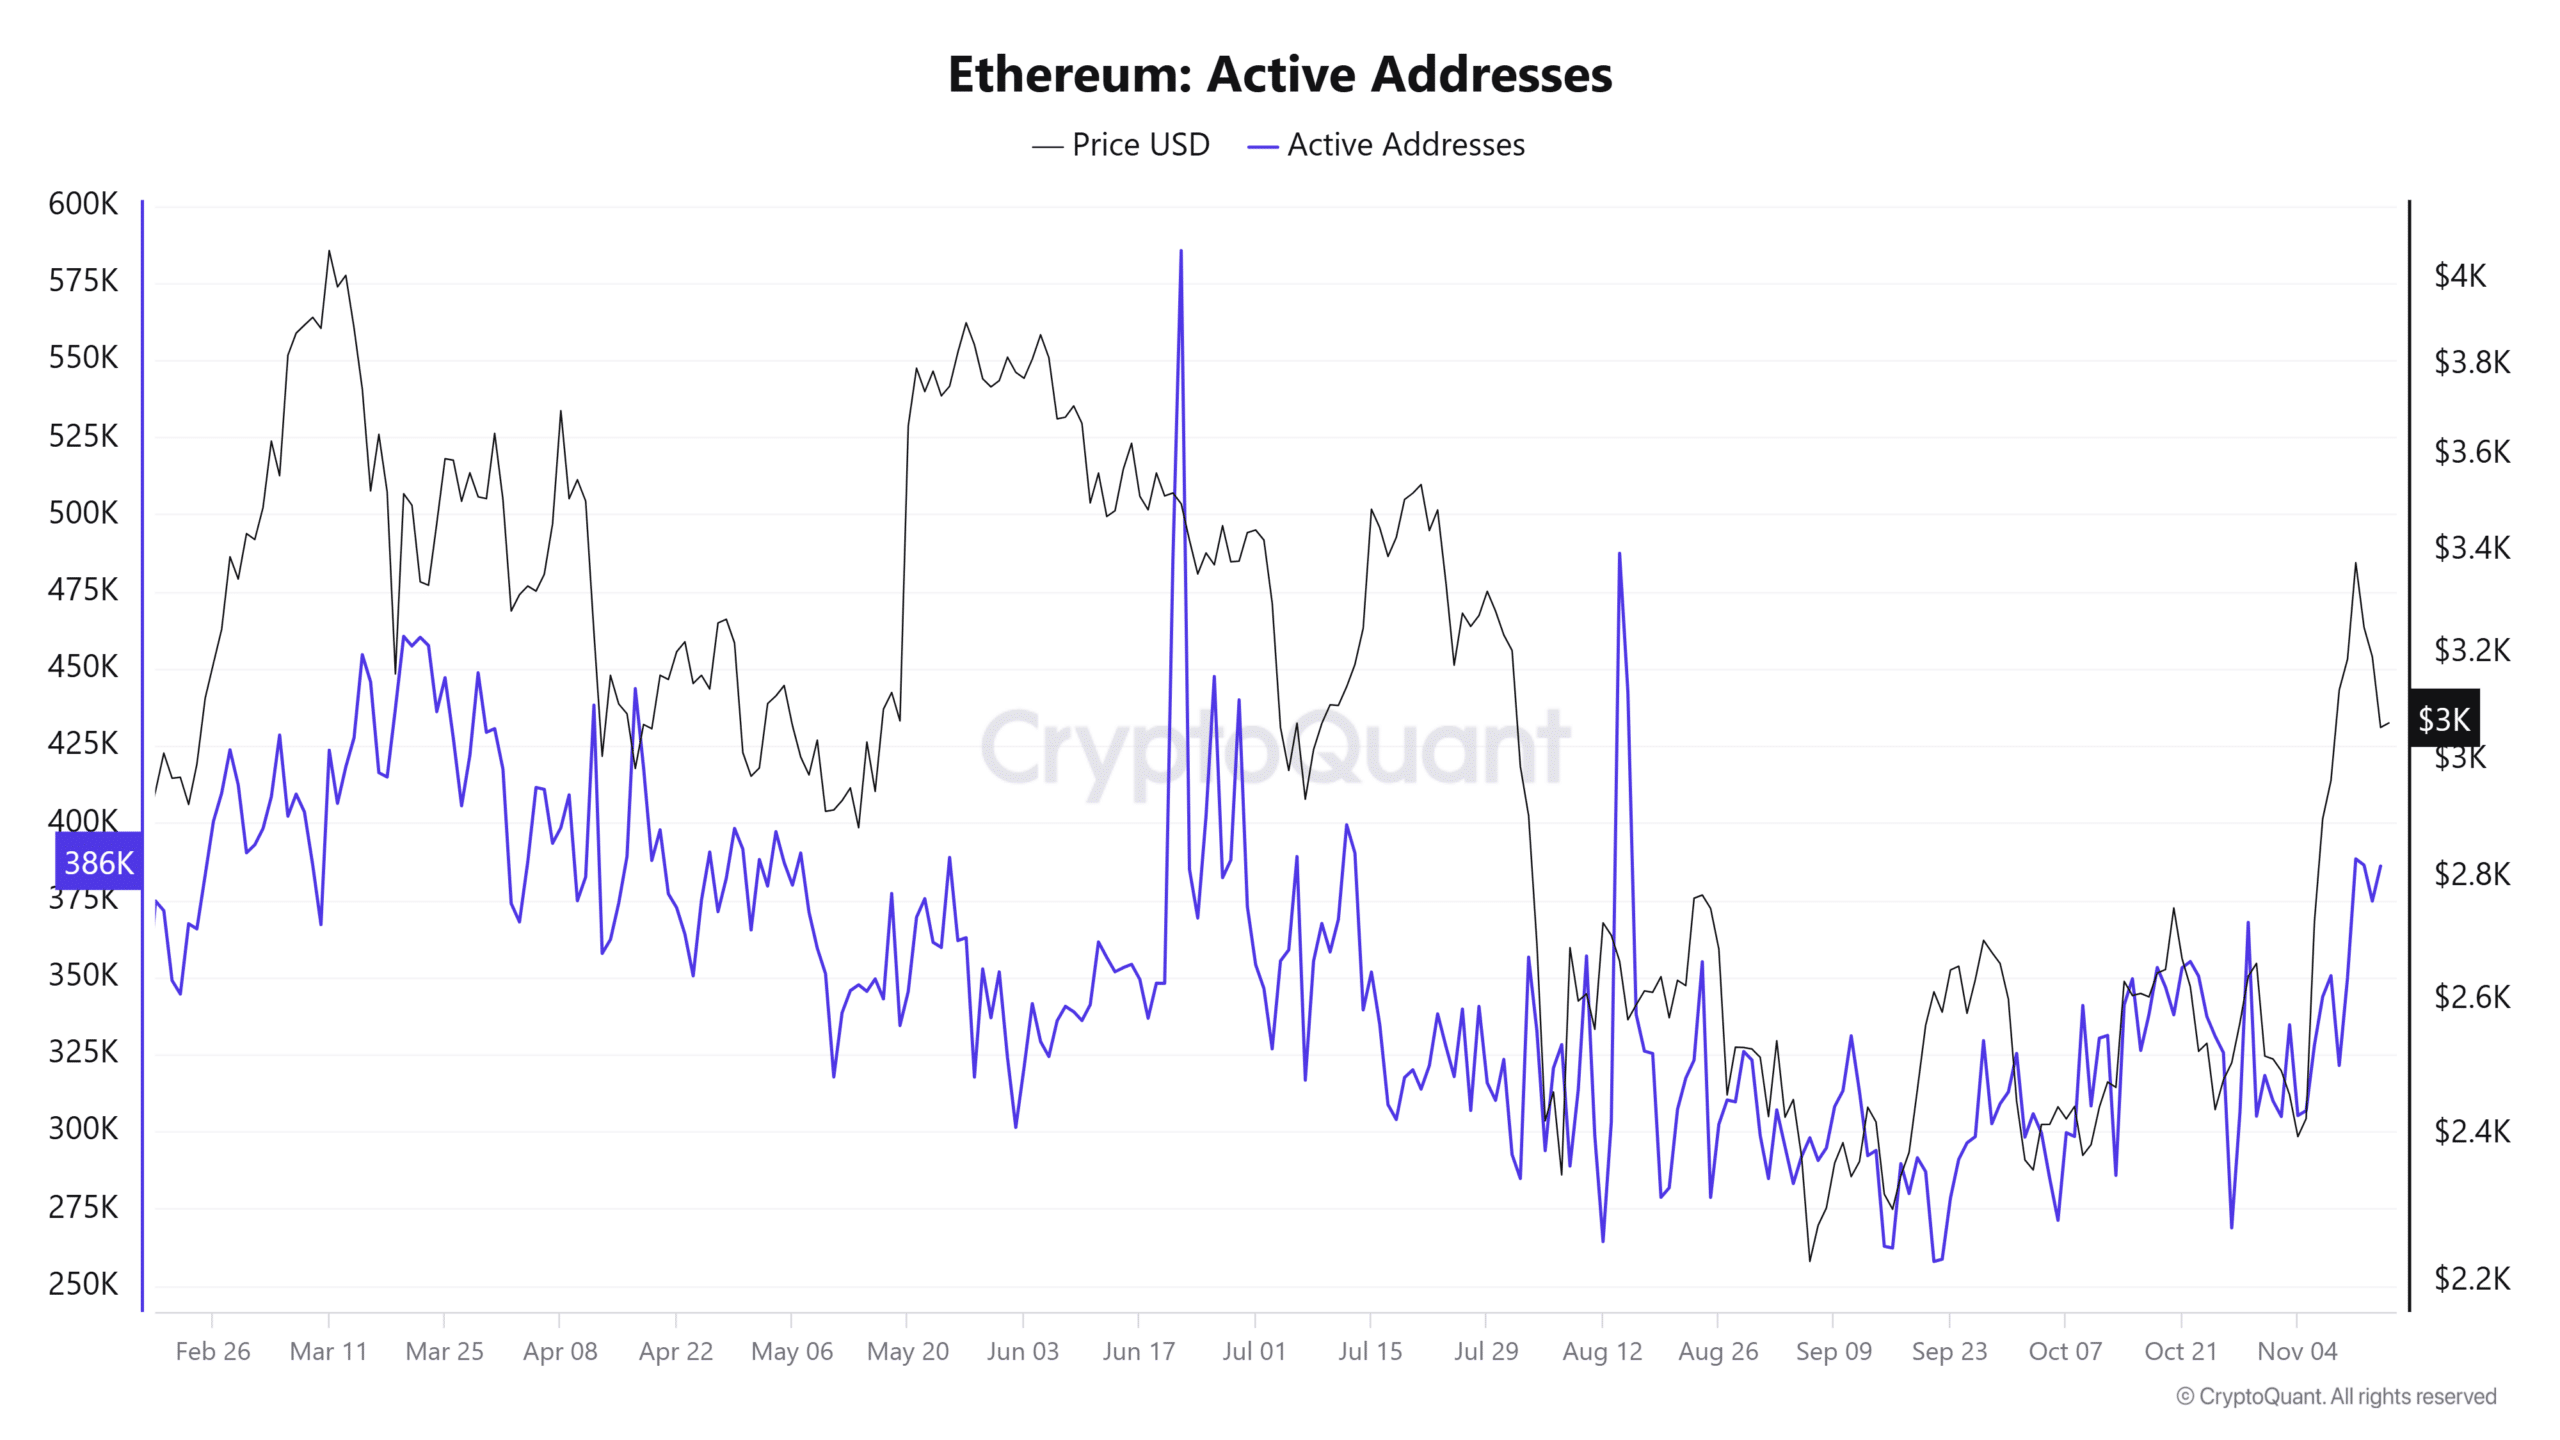
- Positive netflows and an increase in active addresses suggest strong investor activity, despite the short-term bearish pressure.
In the past month, Ethereum [ETH] has rallied by 18.56%, underscoring bullish momentum. However, a 3.63% decline has begun, and this dip is expected to deepen briefly before ETH finds support.
Market sentiment and technical indicators still favor a potential rally once this consolidation phase concludes, keeping the long-term outlook bullish.
Slight decline could propel ETH to new highs
At the time of writing, ETH was trending downward, briefly touching a Fibonacci retracement line that currently acts as support.
The Fibonacci retracement tool, widely used to identify support and resistance levels, marks this support at $3,028.87. However, this level is expected to provide only temporary relief from further price declines.
If ETH breaks below this level, the next target is a minor drop to $2,900.87, representing a 50% retracement from its overall rally. This level is significant, as it has acted as a catalyst for ETH’s recovery on four prior occasions, including two major rallies.

Source Trading View
Should this support hold again, ETH’s bullish momentum could reignite, with a potential push toward a target of $3,971.02.
Key metrics point to selling pressure
ETH is in for a potential price drop as multiple key metrics converge, indicating increased selling activity. At the current support level of $3,028.87, downward pressure appears imminent.
A significant driver is the positive exchange netflow, with over 32,600 ETH recently moved to exchanges, likely for liquidation. This influx typically signals heightened selling pressure, limiting the asset’s ability to rally further.


Source: Cryptoquant
Another critical factor is the sharp rise in active addresses. Historically, when spikes in activity aligns with price declines, it suggest that the majority of these addresses are engaged in selling rather than buying.


Source: Cryptoquant
These combined metrics suggest that ETH is likely to break below its current support, which would trigger a short-term decline in price.
Ethereum decline expected to be temporary
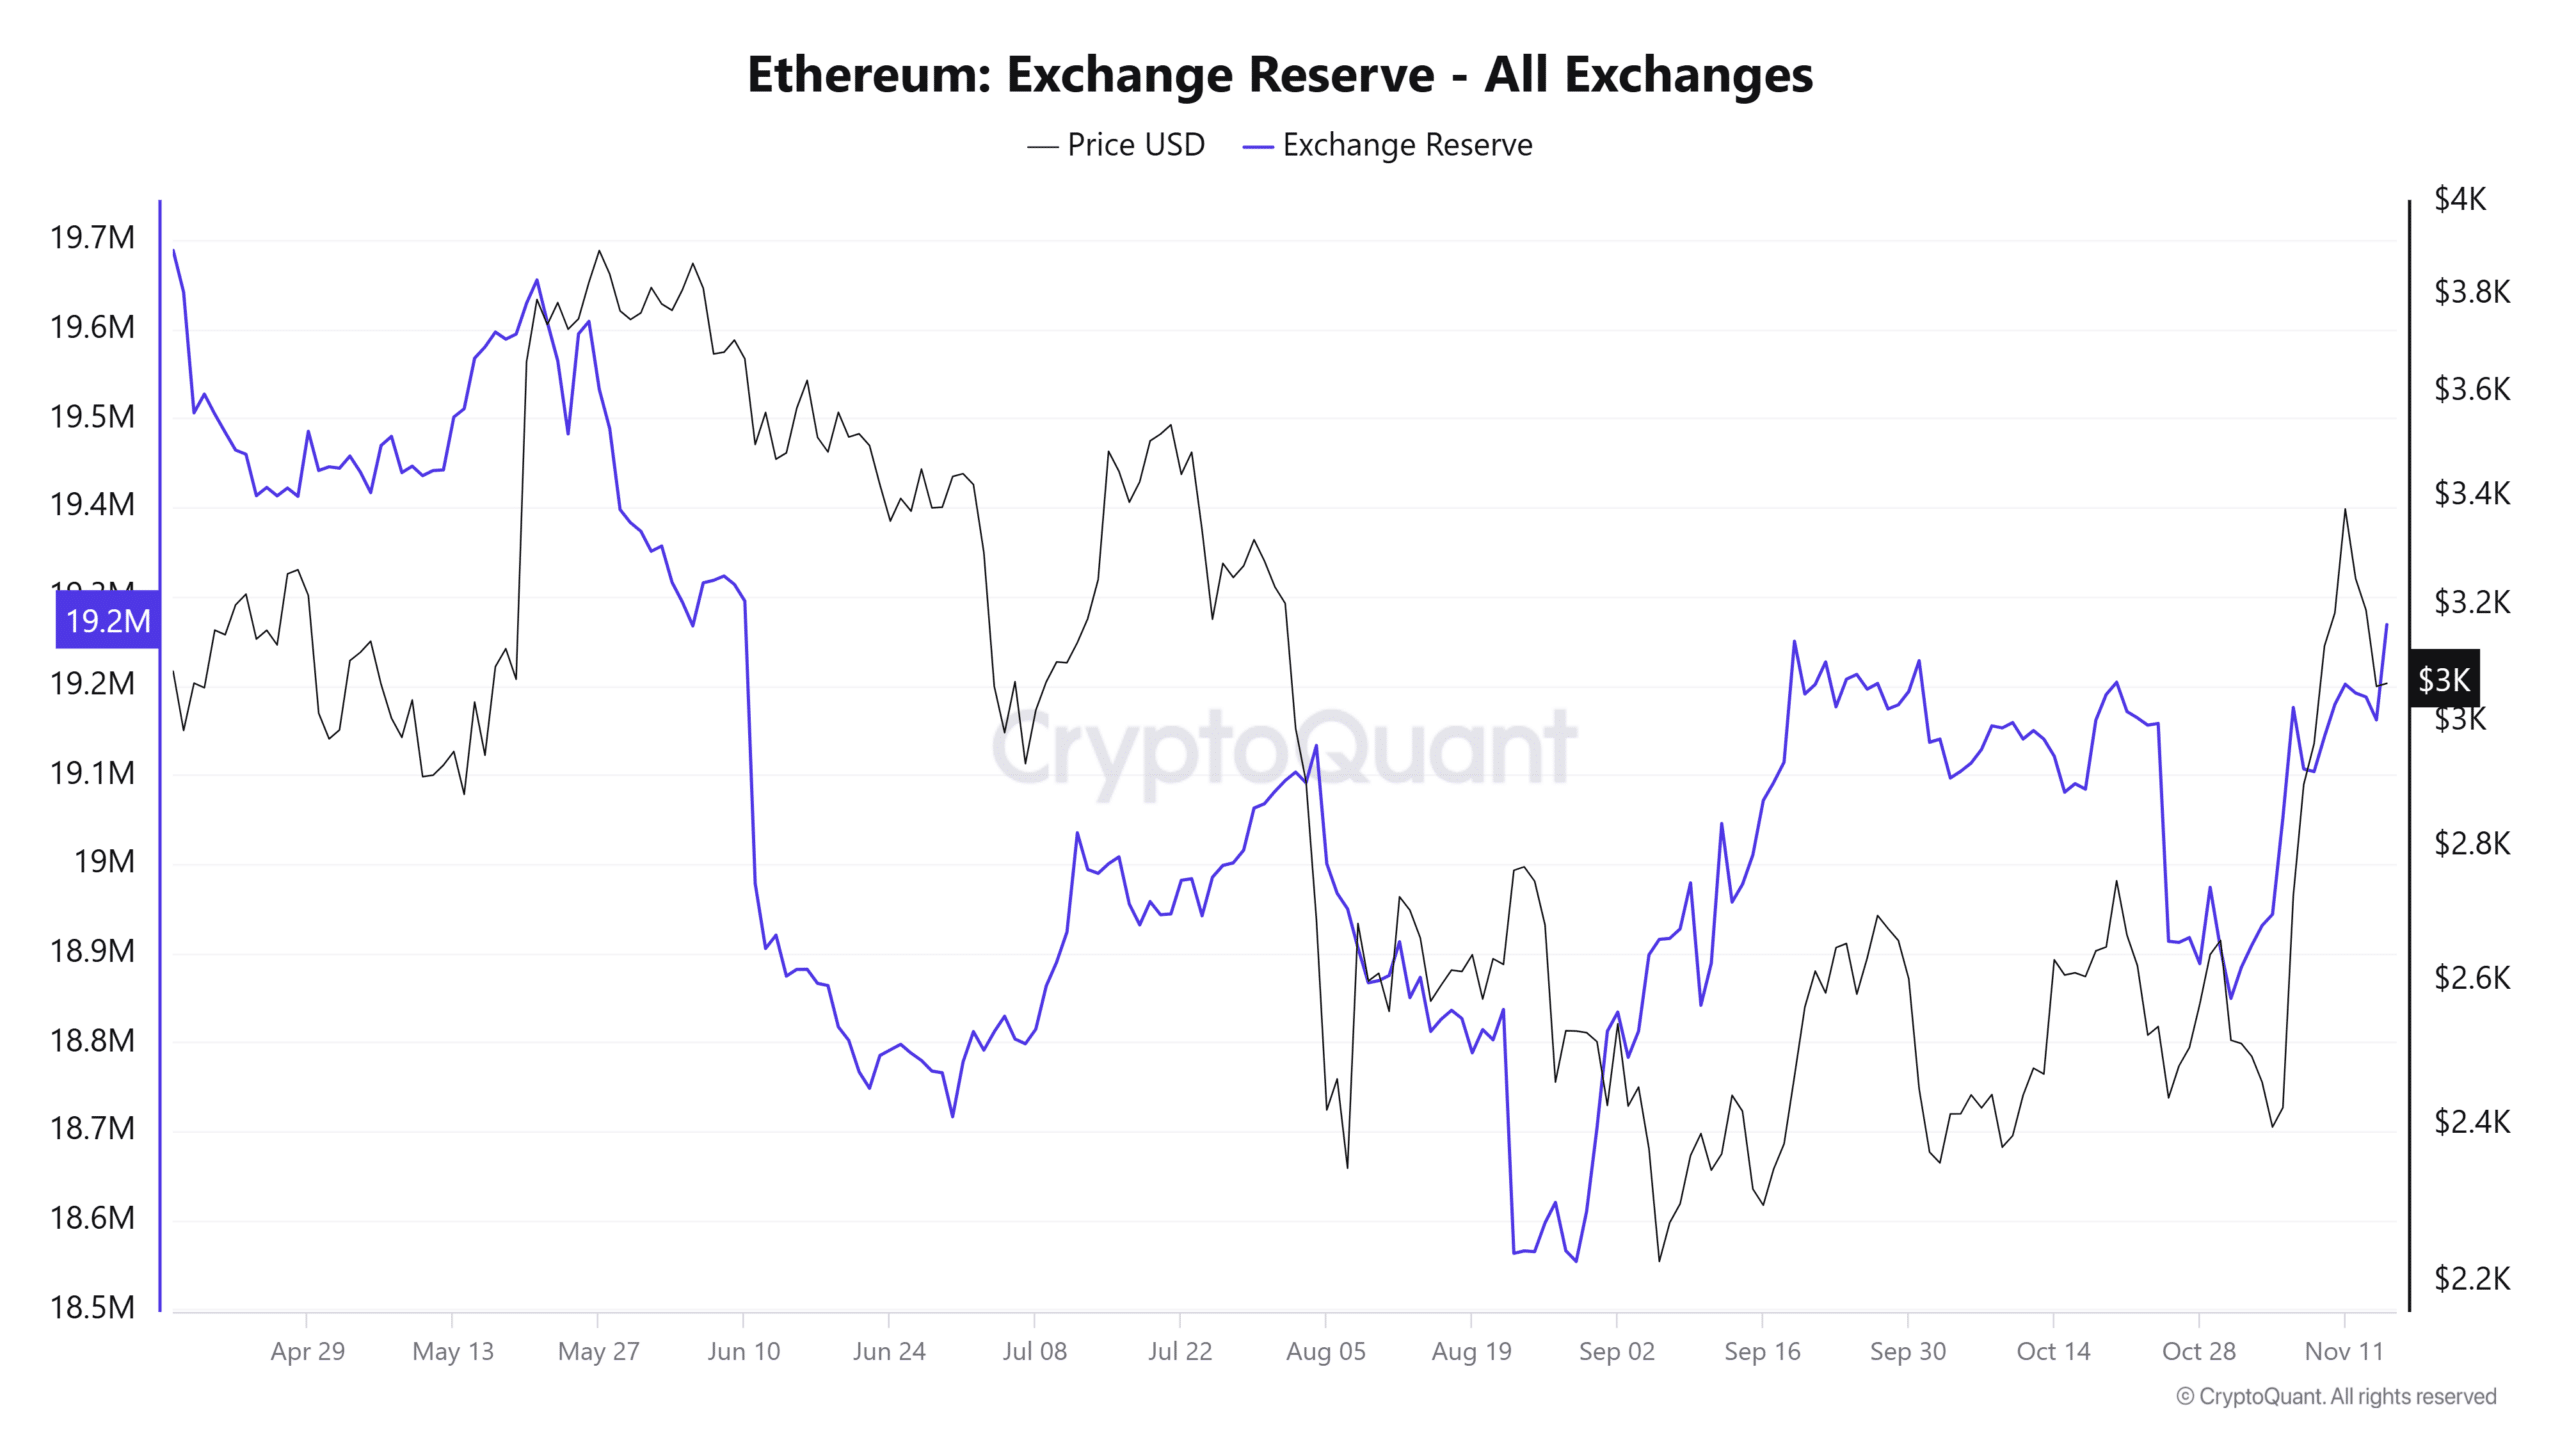
Recent data from the Exchange Reserve indicates that ETH’s price drop is driven by an increase in circulating supply on exchanges, which typically contributes to selling pressure.
Read Ethereum’s [ETH] Price Prediction 2024–2025
However, while a decline appears inevitable, it is likely to be short-lived. The daily and weekly increases in the Exchange Reserve have been minimal, at 0.03% and 0.32%, respectively.


Source: Cryptoquant
If this trend persists, the $2,900.87 support level is expected to act as a key point of attraction, serving as both a target for the current decline and a potential launchpad for the next rally.

