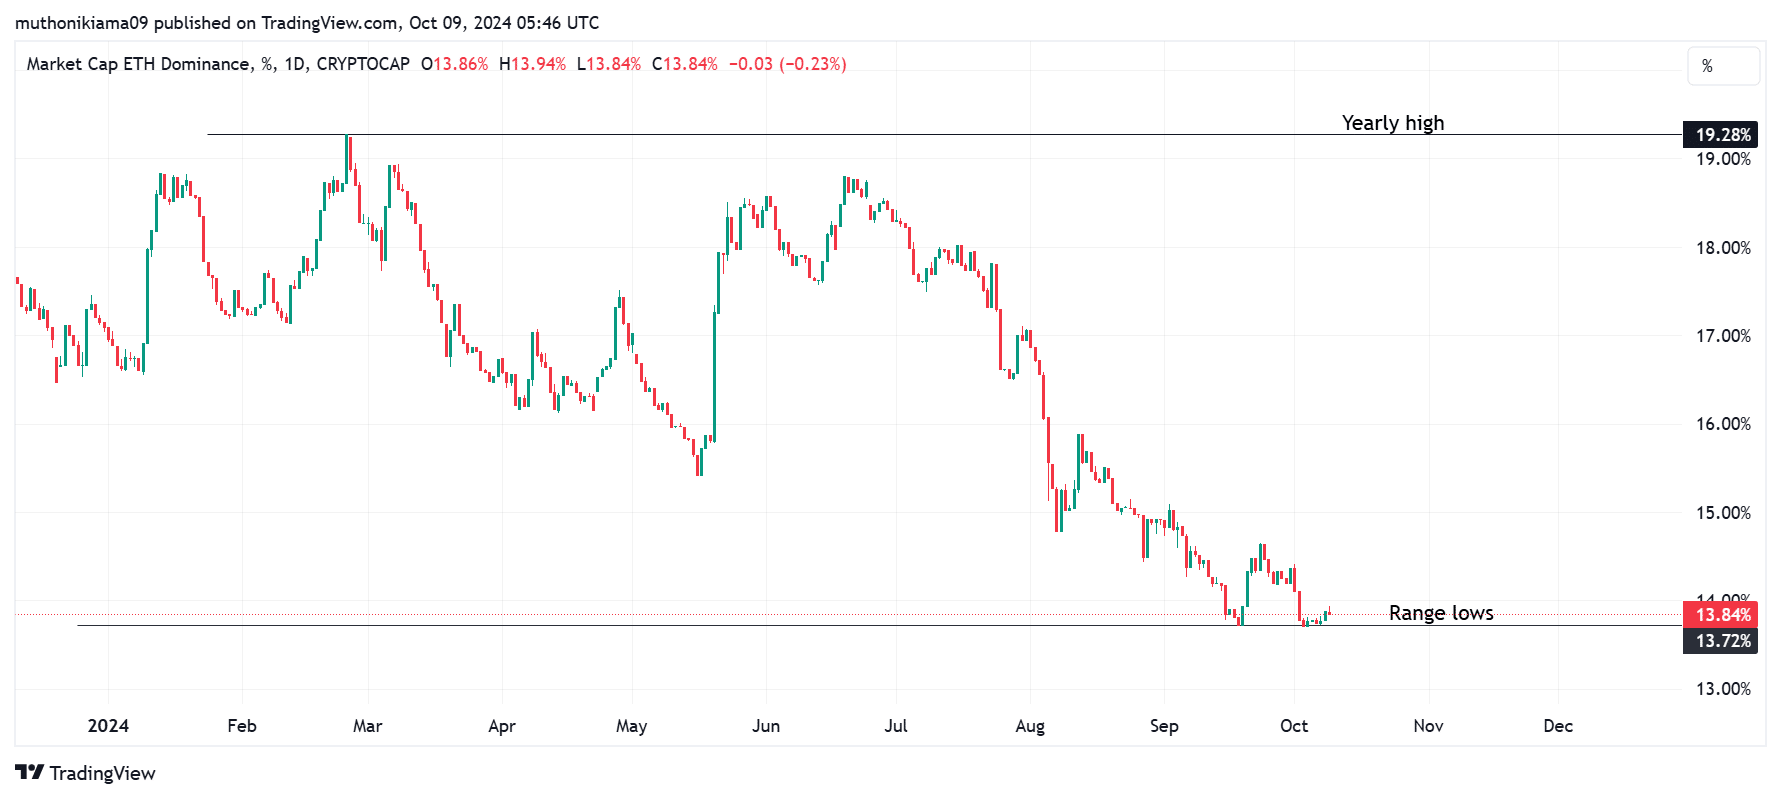
- Ethereum’s market dominance has dropped to range lows at 13%.
- The declining market share comes amid weakening demand, rising supply, and Bitcoin’s rising dominance.
Ethereum [ETH] has been underperforming against Bitcoin [BTC] over the past year. For instance, Bitcoin has gained more than 120% year-on-year (YoY), while Ethereum has gained around 50%.
Ethereum’s underperformance has seen its market dominance tank to range lows. At press time, it stood at 13.85%, a notable drop from a yearly high of nearly 20%.
Source: TradingView
Several factors have spurred the declining dominance of the largest altcoin, and its underperformance against Bitcoin.
Bitcoin’s rising dominance
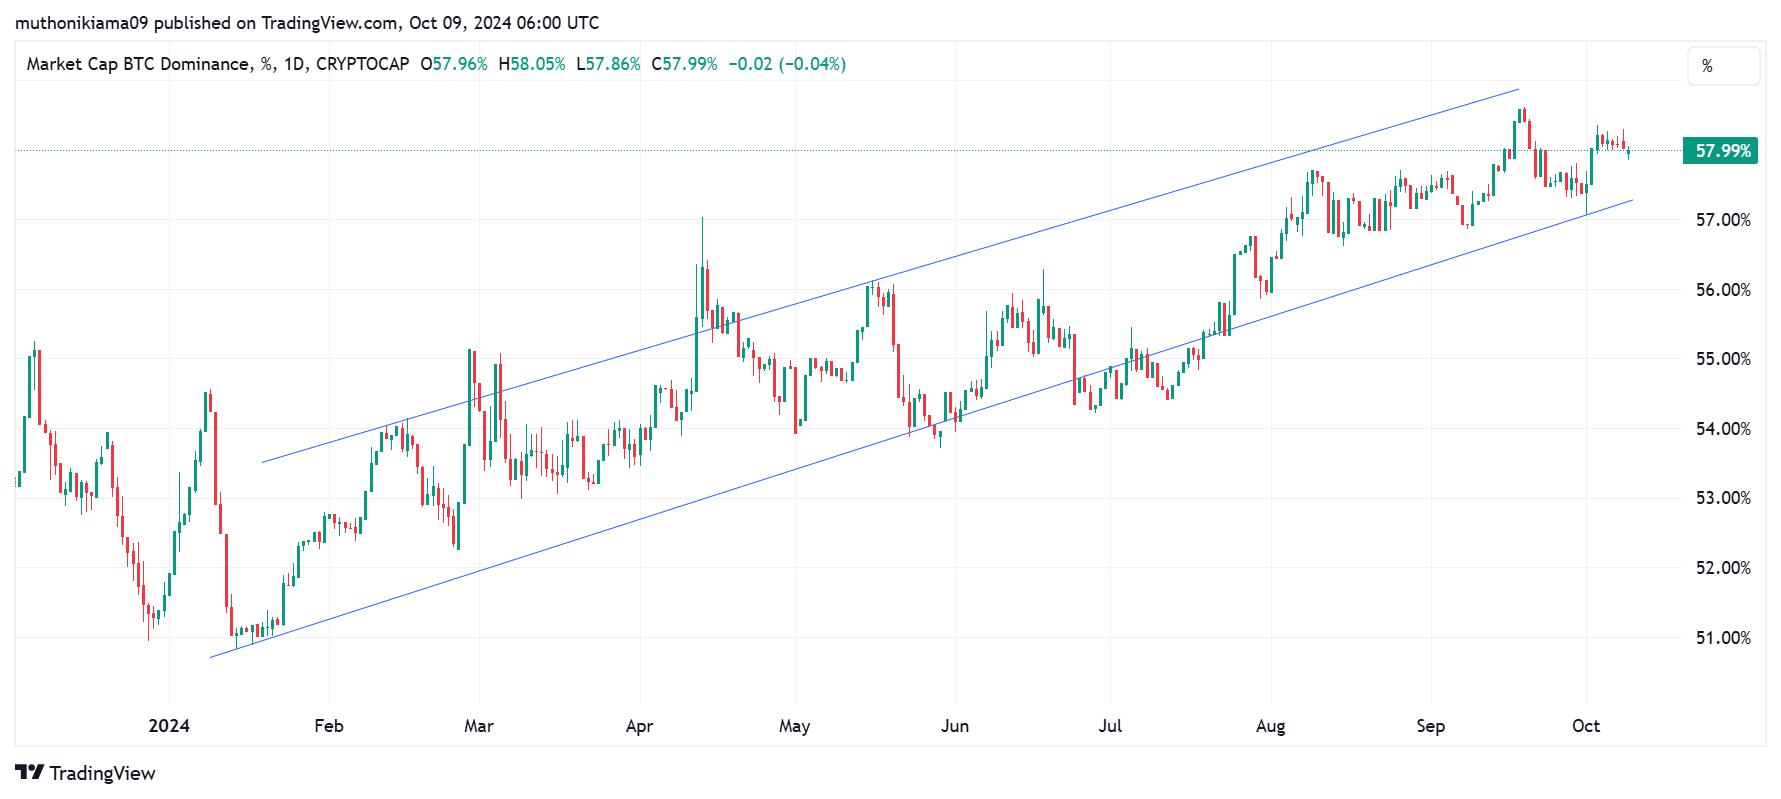
Bitcoin has witnessed a significant increase in dominance this year. This metric has been forming higher highs and moving within an ascending channel since the start of the year.

Source: TradingView
One key factor triggering a rise in Bitcoin’s dominance is the high demand for spot Bitcoin exchange-traded funds (ETFs).
Data from SoSoValue shows that spot Bitcoin ETFs currently hold more than $57 billion worth of BTC. This shows high institutional interest that is fuelling positive price performance.
Whales are selling Ethereum
The other factor causing a drop in Ethereum dominance is whale selling activity.
On the 8th of October, a large address that participated in the 2014 Initial Coin Offering (ICO) deposited 5,000 ETH to Kraken, valued at $12M.
This whale has deposited around 50,000 ETH valued at $125M to exchanges in the last two weeks per SpotOnChain.
The Ethereum Foundation, which has also been on a selling spree, has contributed to Ethereum’s underperformance. Since the beginning of the year, this institution has sold more than $10M worth of ETH.
An uptick in whale selling activity without a rise in demand could see ETH continue trading rangebound if new buyers fail to enter the market.
Weak demand for ETH ETFs
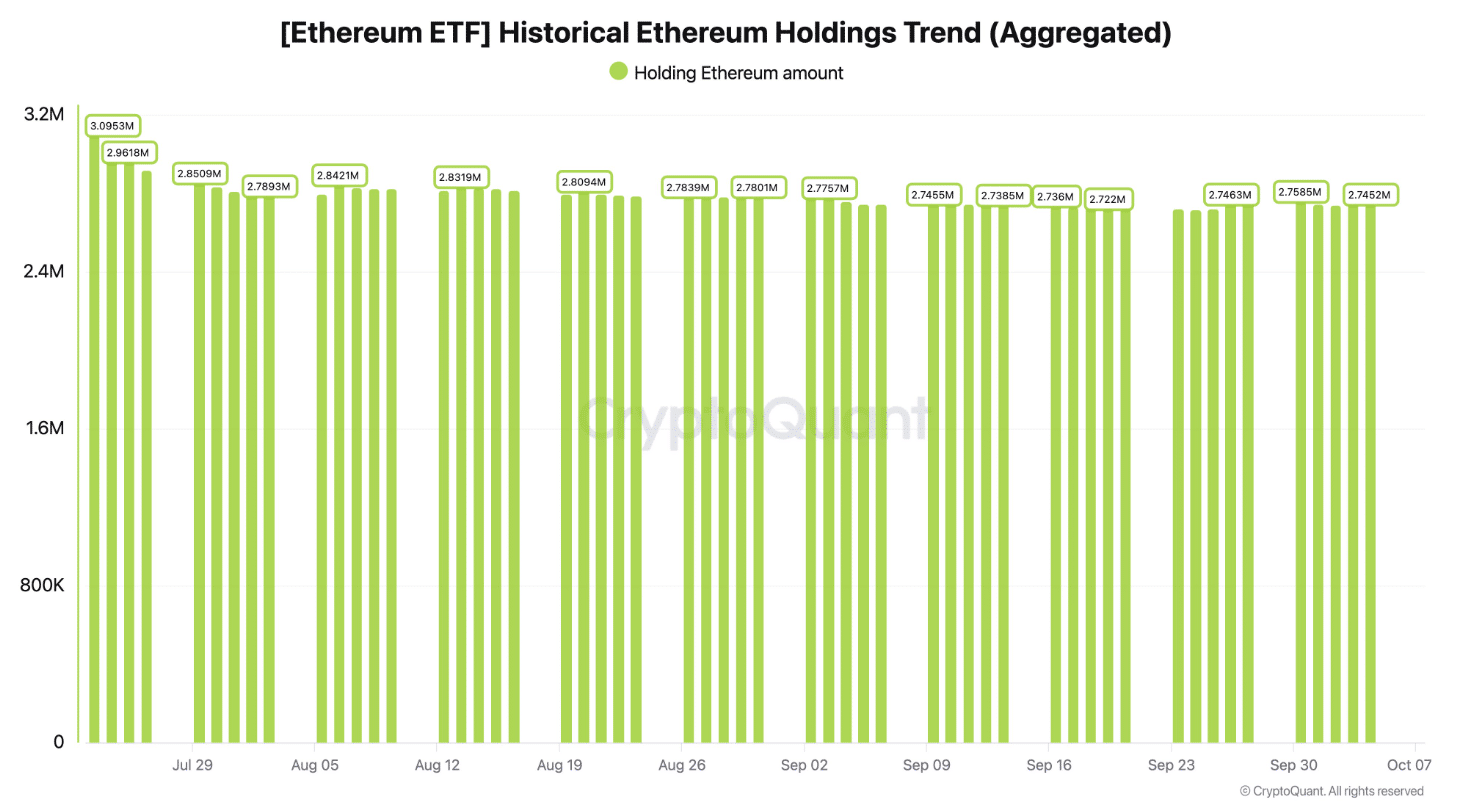
Unlike Bitcoin, Ethereum has recorded low demand for its spot ETFs. Data from CryptoQuant shows that since these ETFs launched in July, they have recorded $849M in outflows.
Source: CryptoQuant
The outflows have been spurred by the Grayscale Ethereum Trust. The ETFs are also struggling with a lack of new inflows.
The BlackRock spot ETH ETF has posted zero inflows in the last two days. At the same time, the Fidelity Ethereum Fund has not seen any positive flows this month according to SoSoValue.
This weak demand has failed to drive gains for Ethereum, which has further contributed to a decline in dominance.
Rising supply
Ethereum is also struggling with a declining burn rate as the coin turns inflationary. Data from Ultrasound Money shows that in the last 30 days, more than 43,000 ETH tokens were added to the circulating supply.
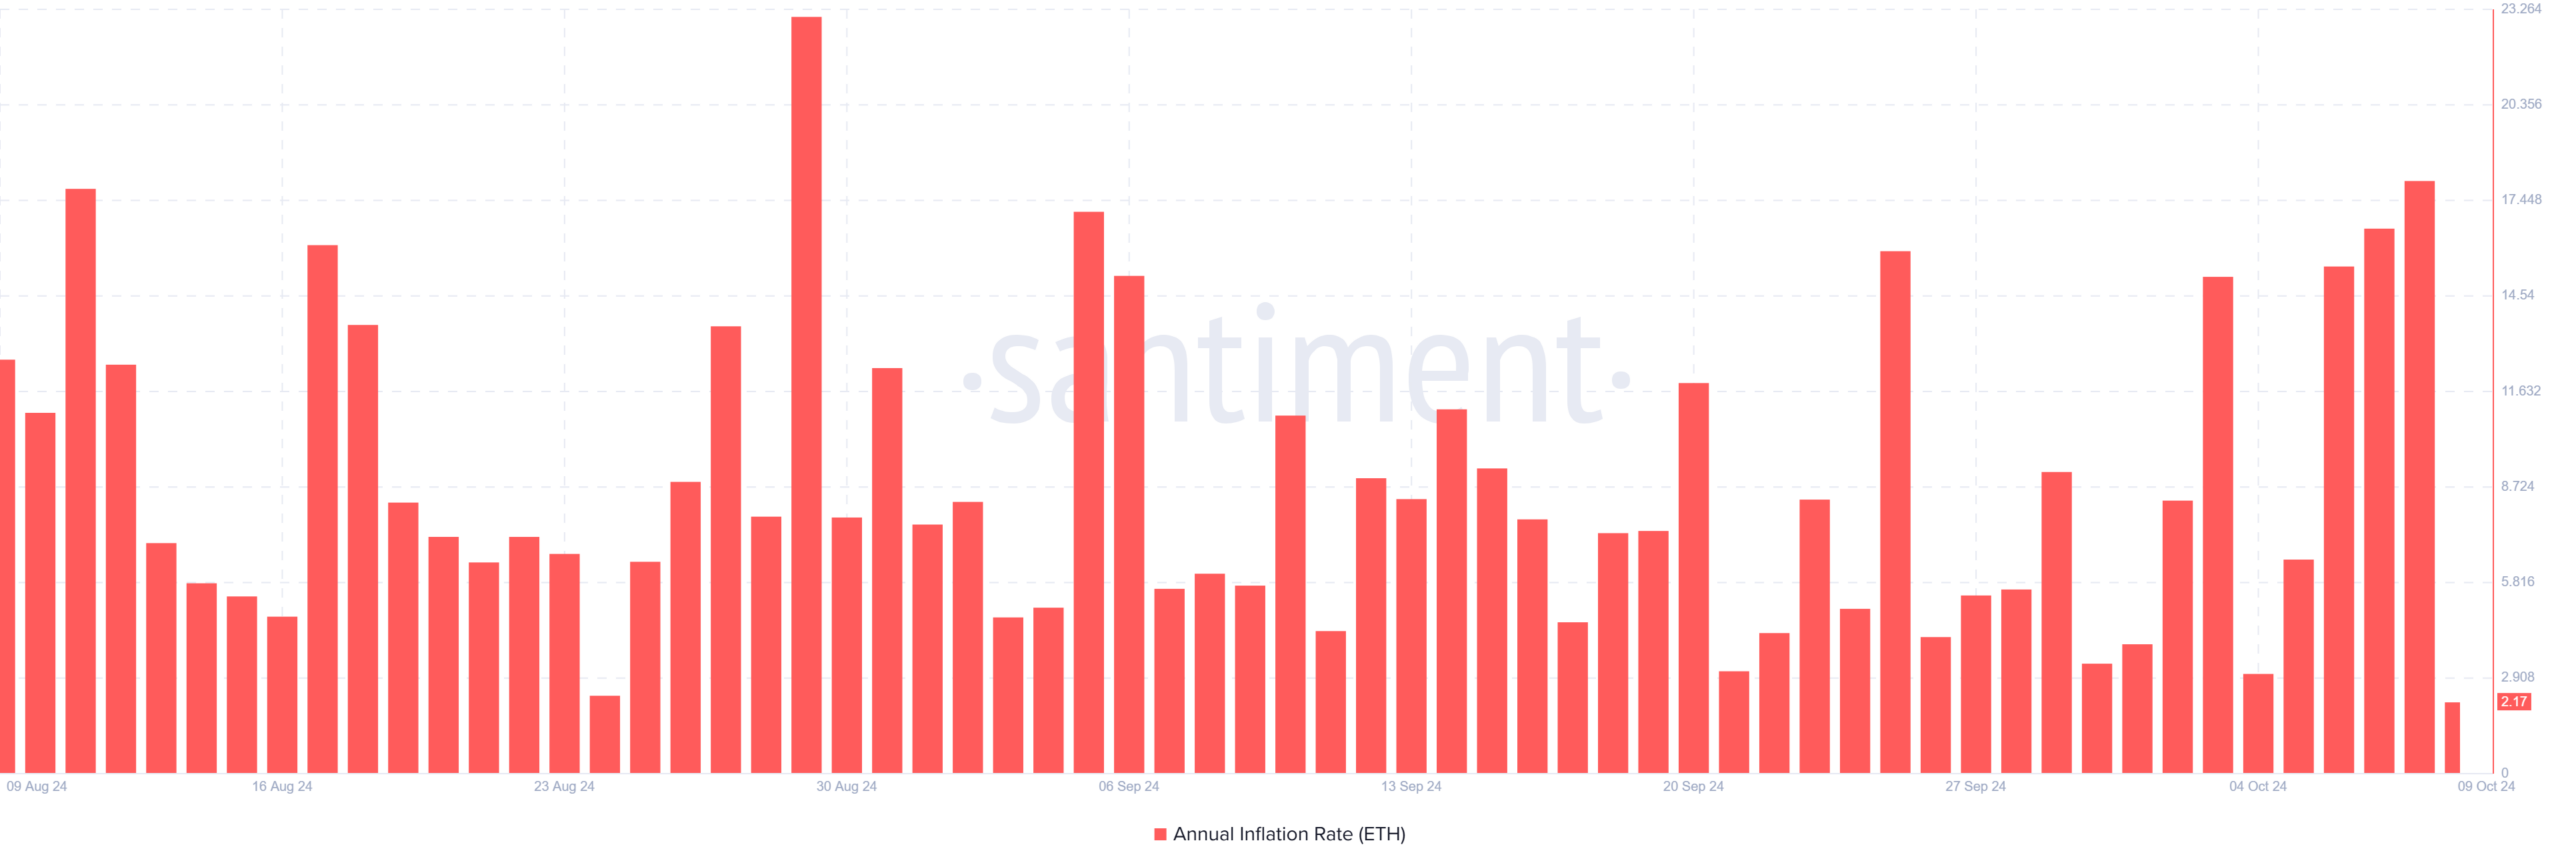
Data from Santiment shows that Ethereum’s annual inflation rate recently reached 18%, the highest level since August.
Source: Santiment
Read Ethereum’s [ETH] Price Prediction 2024–2025
The lack of fresh demand to absorb this rising supply is bound to increase sell-side pressure on Ethereum causing it to lose its market share to Bitcoin and other altcoins.
Ethereum’s falling dominance has also contributed to weakening market sentiment. Per Market Prophit, most traders are bearish on Ethereum while smart money or institutions remain bullish.
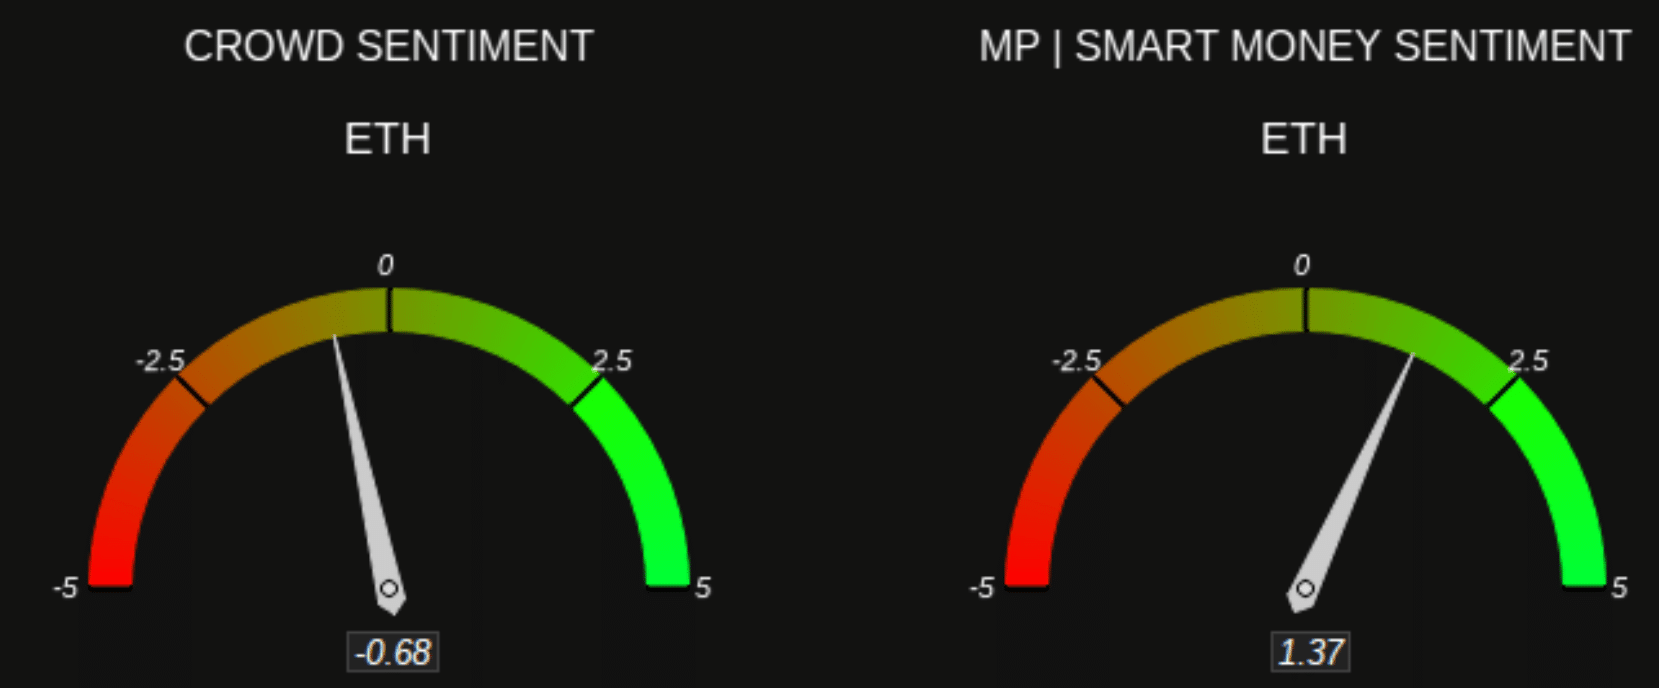

Source: Market Prophit

