- Spot traders appear to be preparing for a potential rally, reducing the available supply of APT on exchanges.
- Derivative traders are taking a bearish stance — many are selling or placing short positions.
Aptos [APT] has demonstrated impressive performance in recent weeks despite current market sentiment. Over the past month, the asset has gained 24.34%, while weekly gains stood at a notable 12.76%.
At press time, spot traders had the upper hand, helping APT achieve a modest daily increase of 1.08%.
However, the sustainability of this rally remains uncertain. The key question is whether bullish momentum can withstand bearish pressure from the derivatives market.
Spot traders seize control of bullish momentum
APT’s recent gains can largely be attributed to the actions of spot traders who have taken a bullish stance.
Data from the Exchange Netflow—a metric that tracks the inflow and outflow of APT across crypto exchanges—showed negative values for two consecutive days.
On the 16th and 17th of November, $2.03 million and $938.67K worth of APT, respectively, were withdrawn from exchanges. This trend demonstrated a shift in sentiment among traders.

Source: Coinglass
Negative Exchange Netflow typically indicated that more assets are being moved out of exchange wallets into private wallets, suggesting accumulation for long-term holding.
This reduction in circulating supply on exchanges created a supply squeeze, often contributing to upward price pressure.
Derivative traders remain aggressive
Derivative traders continued to dominate the market with a bearish stance, as key on-chain metrics, including Open Interest, Liquidations, and the Long-to-Short ratio, signaled declining confidence in a price rally.
Data from Coinglass revealed a significant drop in Open Interest, which fell by 8.03% to $255.58 million.
This indicated that most unsettled contracts were now driven by short traders, who have taken control of the market momentum.


Source: Coinglass
Simultaneously, long liquidations have surged, with $589.38K worth of positions wiped out. This reflected the market’s movement against traders who had bet on a price rally, further amplifying bearish sentiment.
Moreover, the Long-to-Short ratio has declined to 0.8822, indicating that, at press time, short traders outnumbered long traders.
This imbalance places additional pressure on any potential bullish momentum, making a sustained rally less likely in the short term.
APT’s next move on the chart
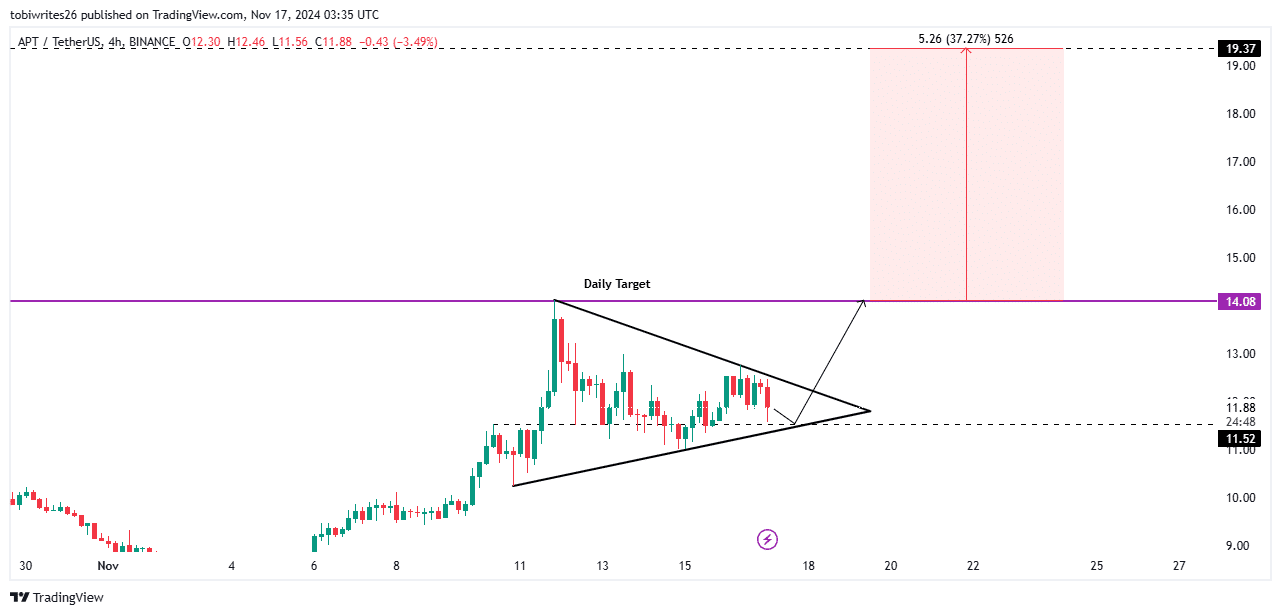
According to the chart, APT was in a consolidation phase at press time, trading within a symmetrical triangle pattern after bouncing off the $14.08 resistance.
This pattern often precedes a significant market rally, indicating that APT is set for a potential breakout.
For a continued rally to the upside, APT may first decline slightly to retest the $11.52 support level before rebounding, or it could push higher directly from its current position back toward the $14.08 resistance zone.
However, the $14.08 resistance could introduce significant selling pressure, potentially triggering a minor pullback.
Read Aptos’ [APT] Price Prediction 2024–2025
If bullish momentum remains strong, APT could break through this level, leading to a projected 37.27% gain and a new monthly high of $19.37.


Source: TradingView
Given these dynamics, spot traders appeared to have the upper hand, and this advantage may solidify if currently bearish on-chain metrics begin to shift positive.

