- The weekly structure was flipped bullishly.
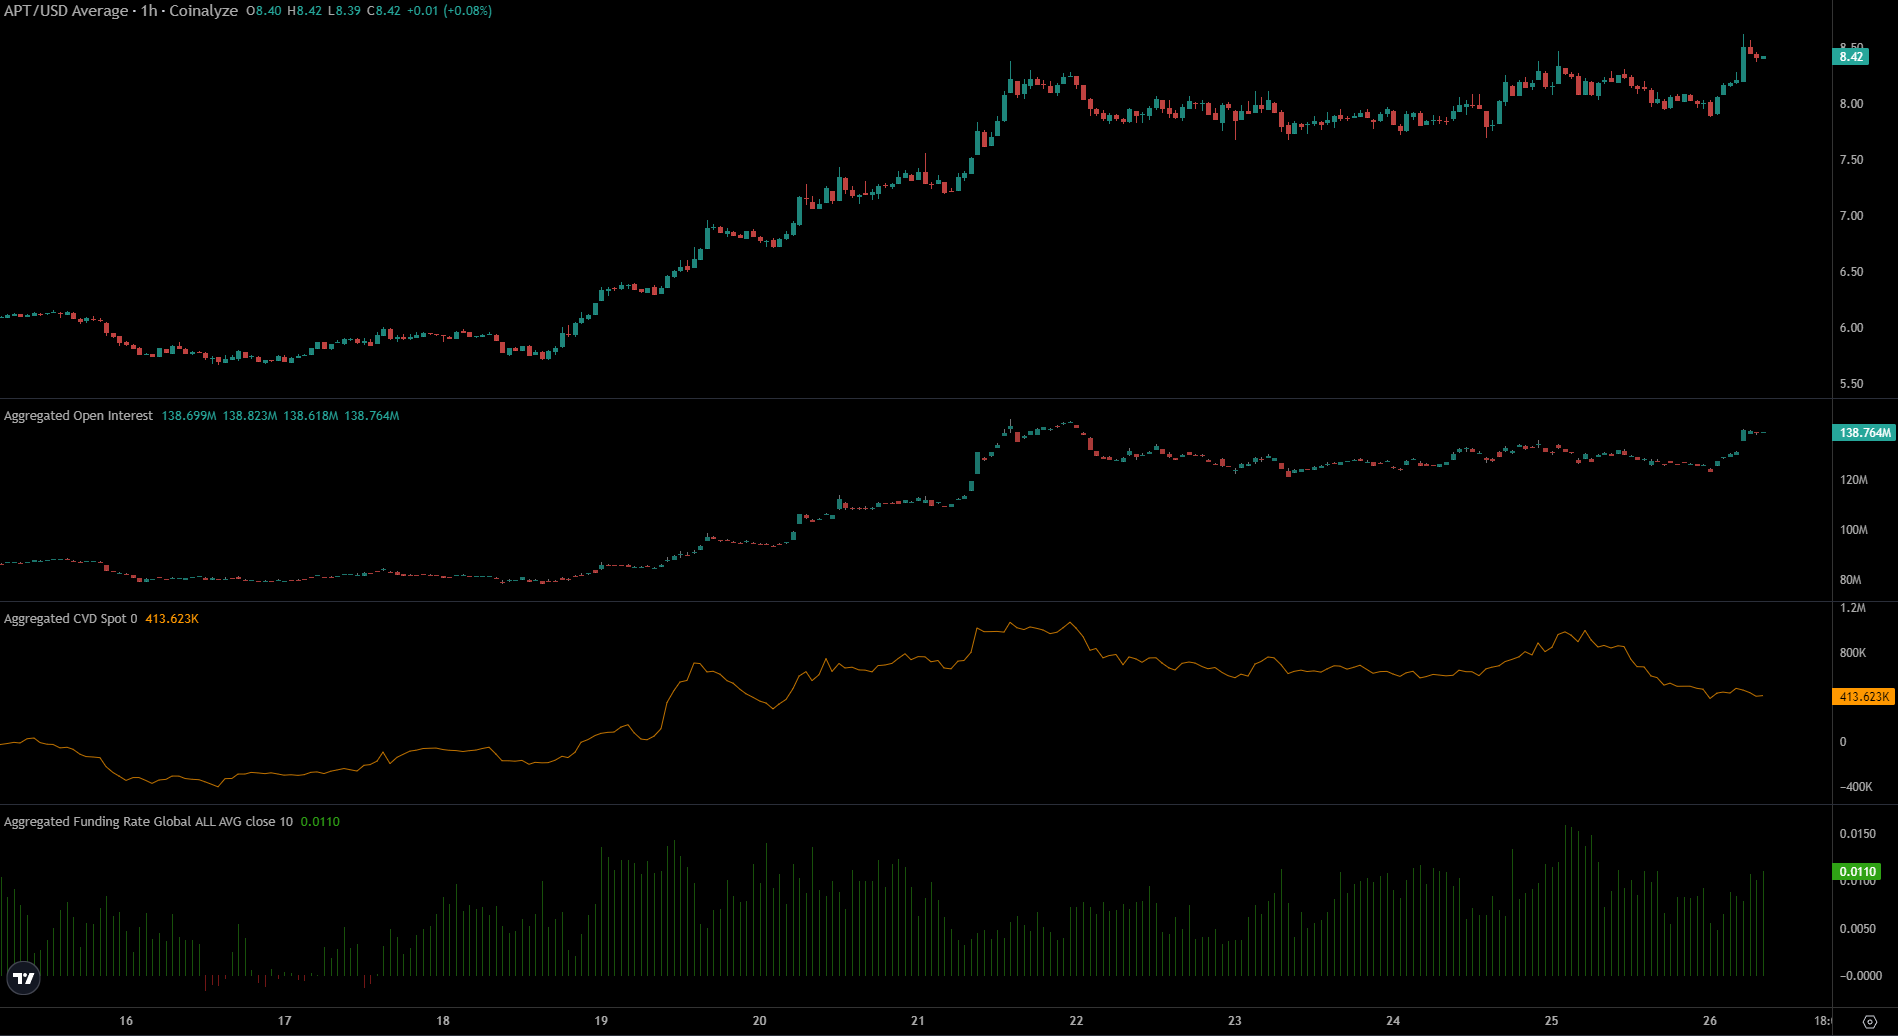
- The decline in spot CVD in the past 24 hours raised questions about a minor price dip.
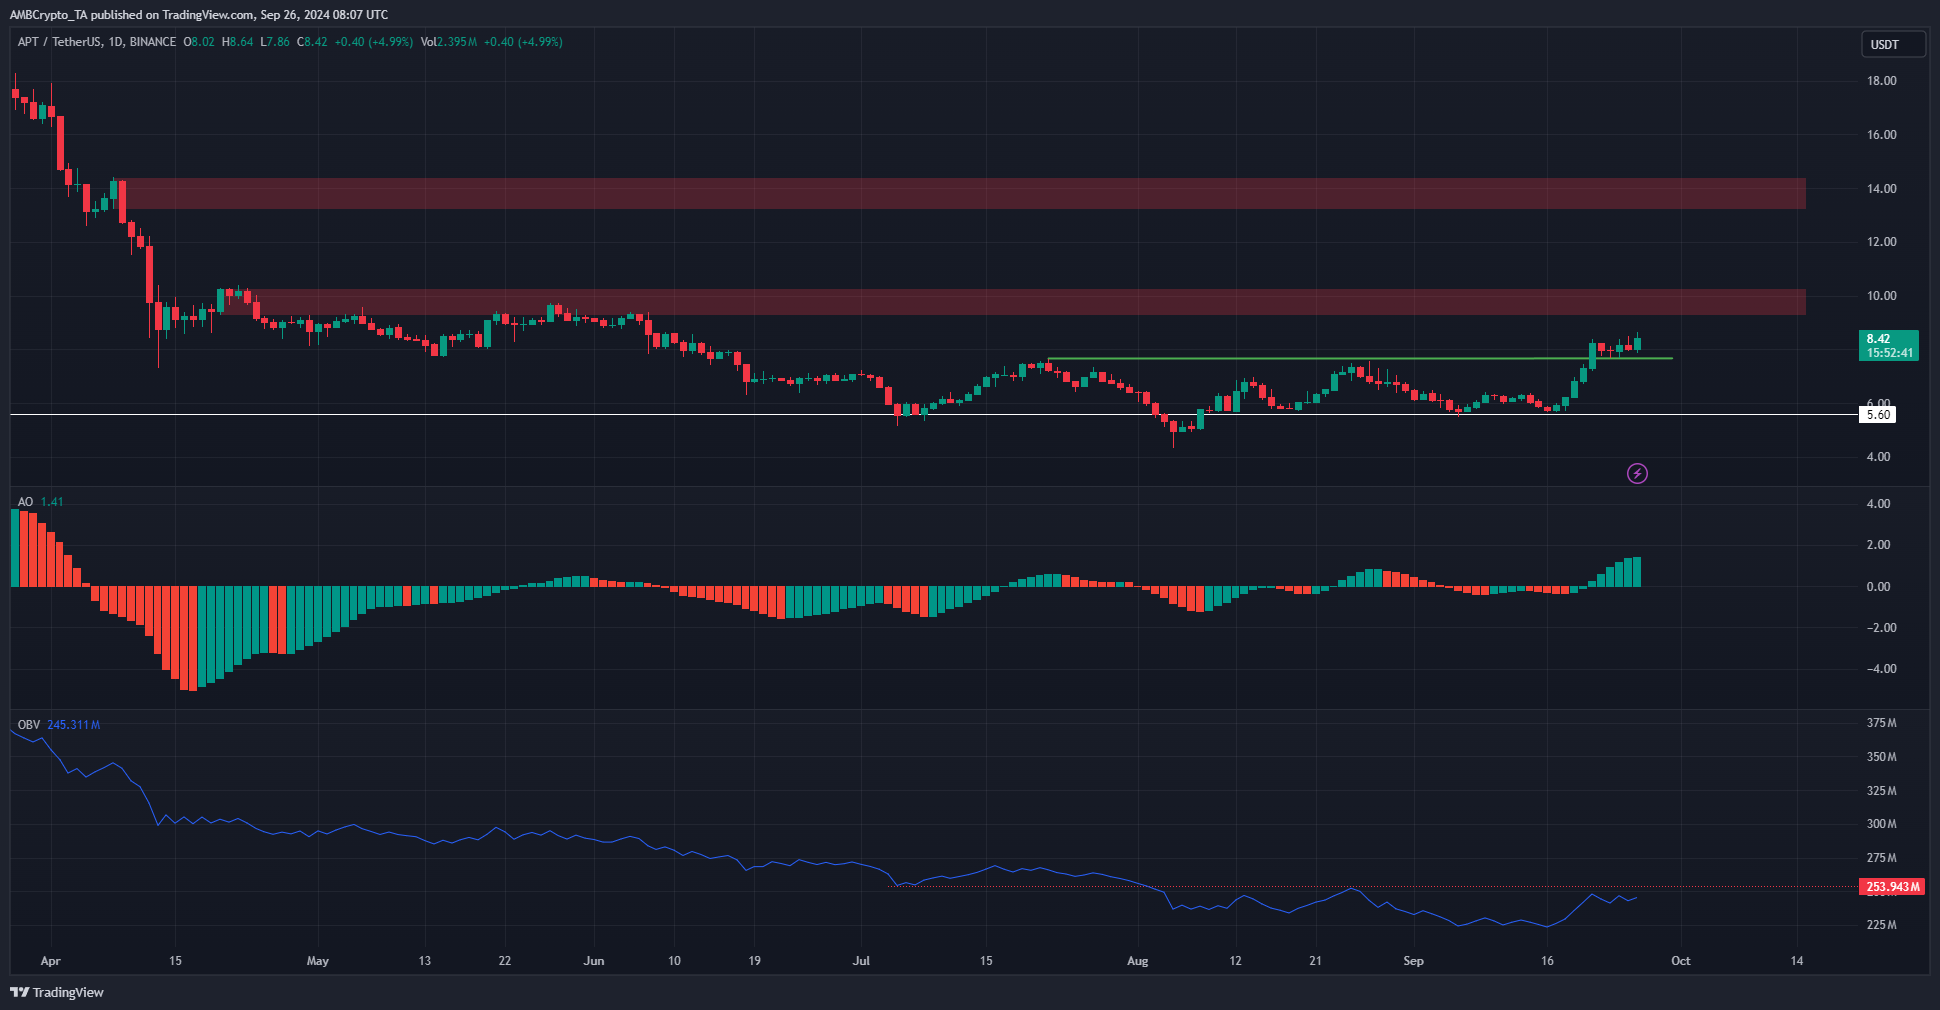
Aptos [APT] was bullishly poised on the higher timeframes after beating a key local resistance at $7.66. The $5.6 support was defended valiantly since July. The volatility across the crypto market hit APT too, but the $5.6 was not ceded.
This allowed the token to make gains worth 47% from the 17th to the 21st of September, moving from $5.68 to $8.39. The volume indicators sowed some doubt about APT’s ability to sustain the move.
Weekly structure break aids the bullish Aptos price prediction

Source: APT/USDT on TradingView
The 47% move higher took only four days. The token raced higher toward the weekly lower high at $7.66. A weekly close above this level materialized, flipping the higher timeframe market structure bullishly.
To change the consolidation from June into an uptrend, Aptos bulls must continue to push prices higher and make a higher low and higher high in the coming weeks.
The daily momentum was bullish, according to the Awesome Oscillator. Yet, the OBV was unable to break a local high that stretched back to August. This was worrying, as it meant the breakout occurred on lowered volume.
To the north, the daily bearish order blocks at $10 and $14 are the next pivotal resistances for APT. The price reaction in these areas will illuminate whether the uptrend can continue.
Declining spot CVD a short-term headache


Source: Coinalyze
The breach of the $7.66 was accompanied by an increase in the Open Interest. This showed bullish sentiment in the short-term in the futures market. This positive funding rate buoyed the likelihood of further gains.
Is your portfolio green? Check the Aptos Profit Calculator
Yet, while Aptos rose above $8.1, the spot CVD has been in decline over the past two days. This showed short-term bearishness. Over the next couple of days, a price correction and a dip below $8 could occur.
The price move of the past 24 hours appeared to be borne majorly by the futures market, which could see a brief consolidation phase and price correction before the next impulse move.
Disclaimer: The information presented does not constitute financial, investment, trading, or other types of advice and is solely the writer’s opinion

