- Buying pressure on Bitcoin increased in the last 24 hours.
- In case of a price correction, BTC might as well drop to $57k again.
Bitcoin [BTC] has finally managed to cross the $60k barrier after struggling for quite a few days. This jump above $60k gave hope for a further price rise. But it might face strong resistance going forward.
Bitcoin climbs above $60k again!
Ali, a popular crypto analyst, posted a tweet revealing that BTC’s TD sequential indicator flashed a sell signal. The tweet mentioned that there might be a short correction.
Notably, that actually happened, as BTC dropped to $58k from $59k. The good news was that the king coin gained bullish momentum after that as it surged above $60k.
The coin’s price rose by more than 4% in the last 24 hours and at press time was trading at $60,363.00 with a market capitalization of over $1.19 trillion.
Thanks to the price rise, over 43 million BTC addresses turned profitable, which accounted for 81% of all Bitcoin addresses.

Source: IntoTheBlock
AMBCrypto then checked CryptoQuant’s data to see how this price uptick affected market sentiment. We found that Bitcoin’s exchange reserve was dropping, signaling a rise in buying pressure.
Additionally, both its Coinbase Premium and Korea Premium indicated that buying sentiment was relatively strong among US and Korean investors.


Source: CryptoQuant
BTC’s next targets
Our look at Glassnode’s data revealed that BTC’s was finally approaching its possible market bottom as it has been trading below it for several weeks.
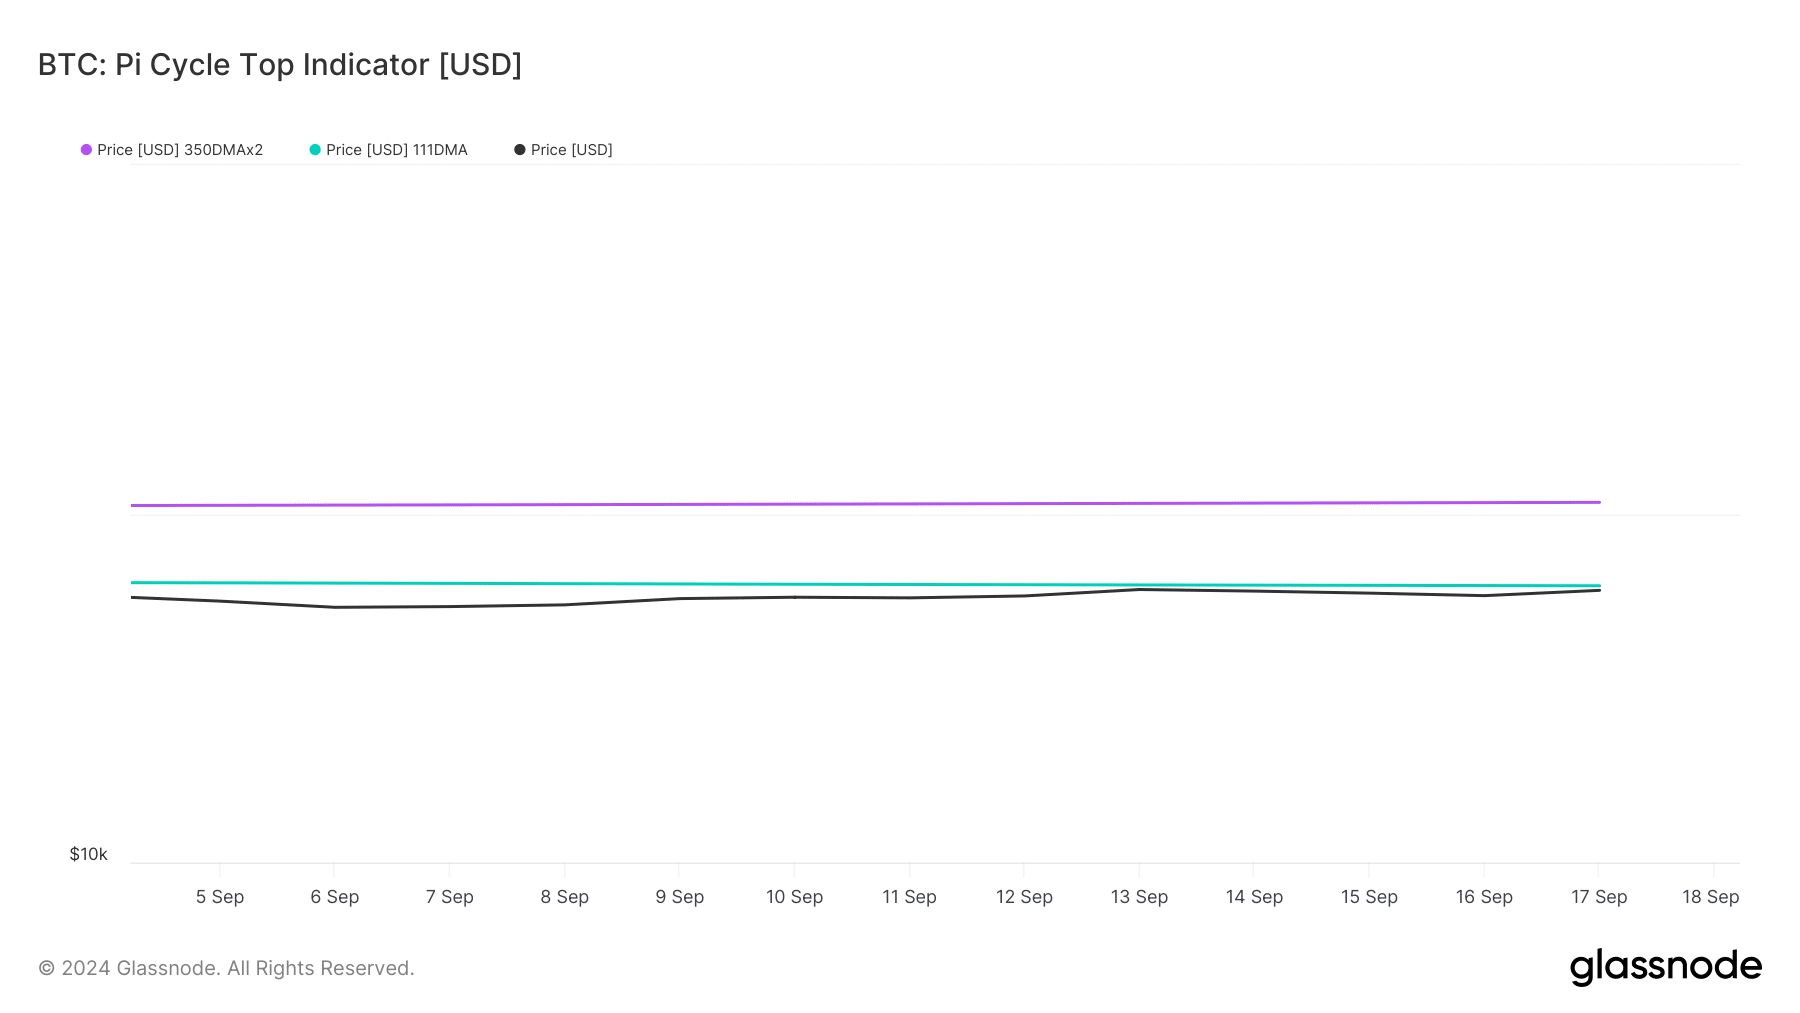
The Pi Cycle Top indicator also suggested that the Bitcoin’s possible market top was above $100k.


Source: Glassnode
In the meantime, IntoTheBlock also posted a tweet highlighting a few notable updates. As per the tweet, on-chain resistance levels were relatively evenly distributed, but a major level to monitor was $64k, where 1.57 million addresses are currently holding at a loss.
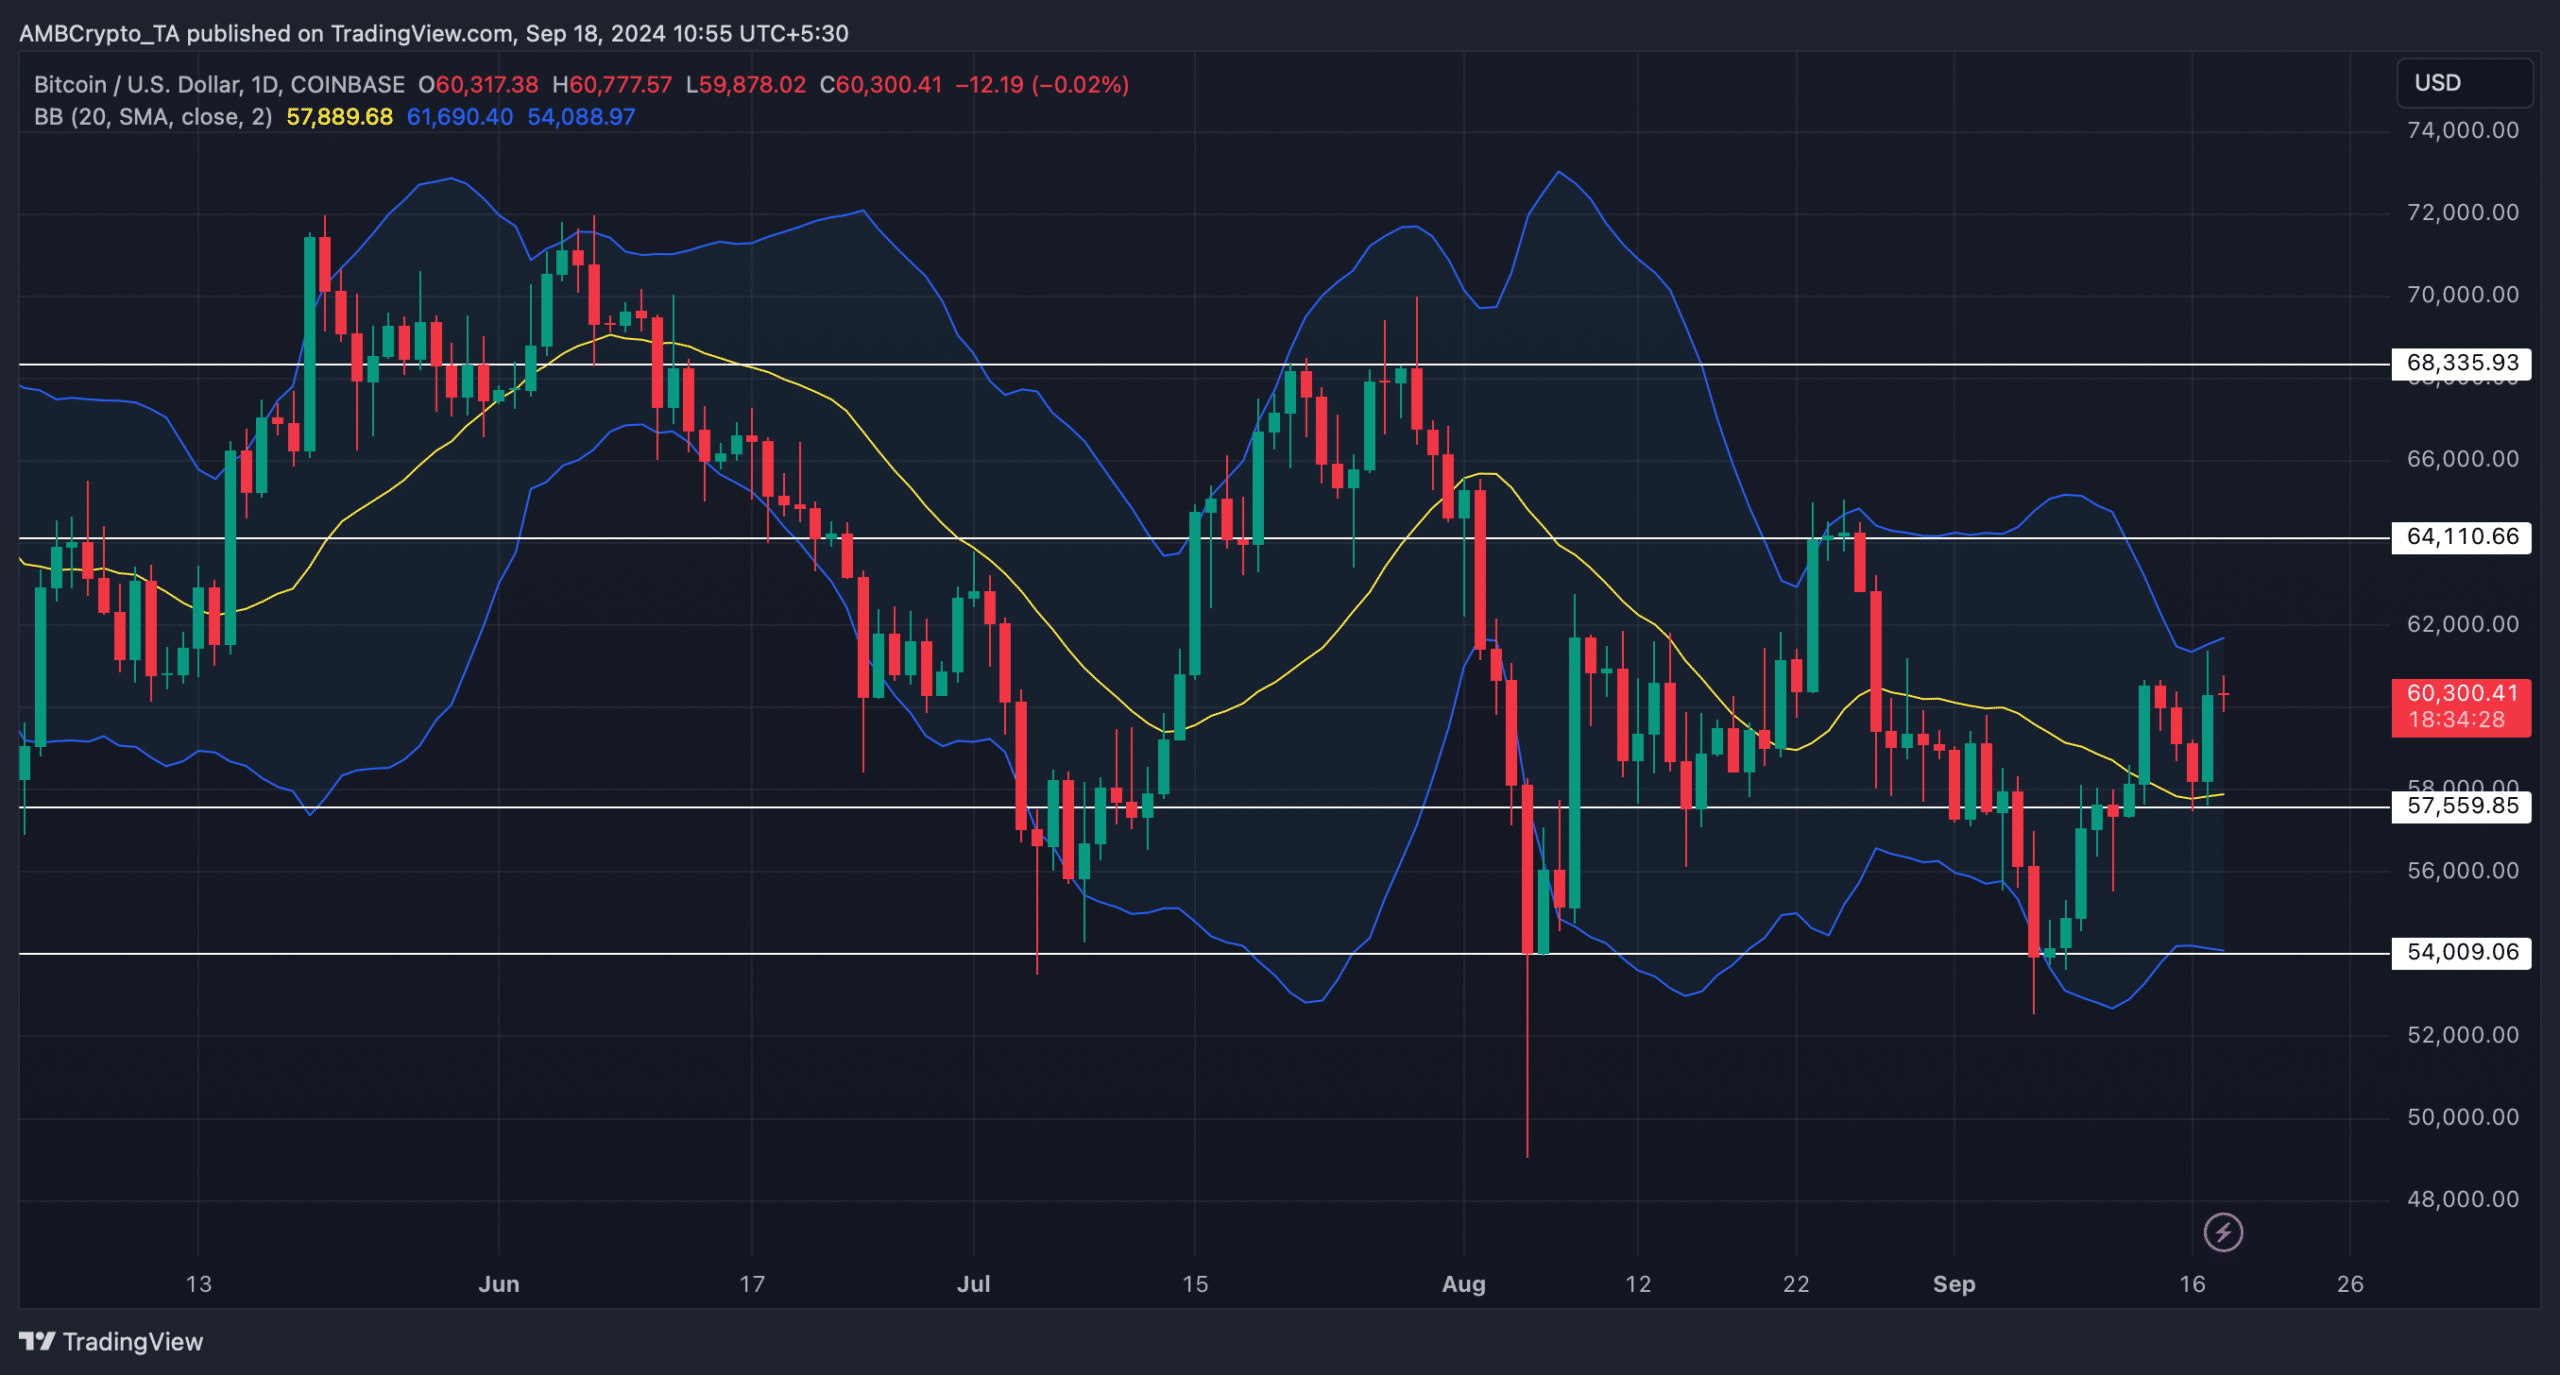
Therefore, AMBCrypto checked Bitcoin’s daily chart to see what market indicators suggested regarding a price hike towards the $64k mark.
As per our analysis, BTC had successfully tested and remained well above its 20-day simple moving average (SMA), as indicated by the Bollinger Bands.
However, Bitcoin’s price had touched the upper limit of the same metric, which often results in price correction.


Source: TradingView
Read Bitcoin’s [BTC] Price Prediction 2024-25
In case the test of the Bollinger Bands’ upper limit results in a price drop, then it won’t be surprising to see BTC once again dropping to $57k. This seemed to be the case as liquidation will rise at that mark.
Nonetheless, if the bull run continues, it’ll be crucial for BTC to go above $62k before it targets $64k.


Source: Hyblock Capital

